

Ecological Pyramids: Definition, Meaning, Types, Importance, Structures, Functions
An Ecological Pyramid explains ecosystem energy flow through the trophic levels. It is a fundamental concept in the NEET exam biology. Each ecological pyramid gives the relationship between producers, consumers and decomposers linked in food chains. There are three main types of ecological pyramid - the pyramid of numbers, the pyramid of biomass and the pyramid of energy. The idea of the ecological pyramid was introduced by Charles Elton (1927) and is also known as the Eltonian pyramid.
This Story also Contains
- Ecological Pyramid in NEET Biology: Definition and Meaning
- Types of Ecological Pyramids - Numbers, Biomass, Energy
- Pyramid of Numbers in the Ecological Pyramid
- Pyramid of Biomass: Upright and Inverted Forms
- Pyramid of Energy: Always Upright in Ecosystem
- Comparison of Ecological Pyramids Types
- Importance of Ecological Pyramids in Ecosystem Energy Flow
- Ecological Pyramid MCQs for NEET Biology
- Recommended Video for Ecological Pyramids

An ecological pyramid is a graphical representation of the trophic levels of an ecosystem. It shows the productivity in ecosystem at each trophic level. The pyramid of numbers shows the count of organisms at each stage, while the pyramid of biomass shows the total living matter. The pyramid of energy is always vertical, showing the one-way flow across trophic levels. For NEET Biology, understanding ecological pyramids is important as the exam focuses on the difference between the pyramid of numbers, the pyramid of biomass and the pyramid of energy.
Ecological Pyramid in NEET Biology: Definition and Meaning
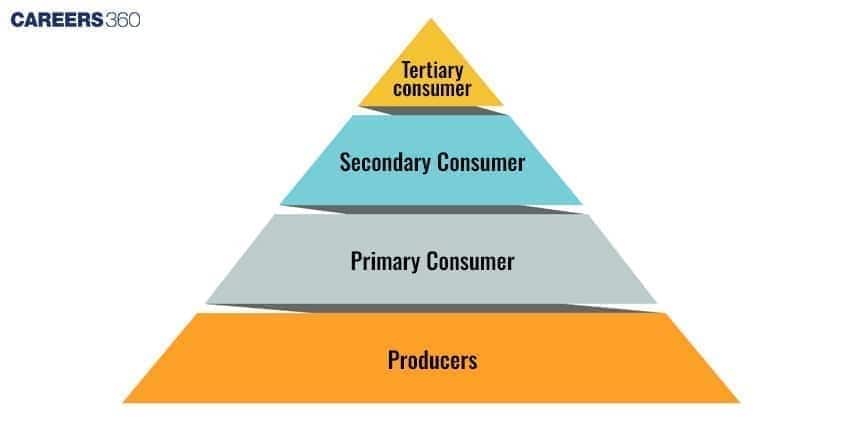
An ecological pyramid is a graphical diagram which shows the trophic relationships in an ecosystem. It represents the structure and function of the transfer of energy, biomass, and the number of organisms within each trophic level.
An ecological pyramid helps ecologists study ecosystem energy flow. It is done through food chains and measures the efficiency of energy conversion at each trophic level.
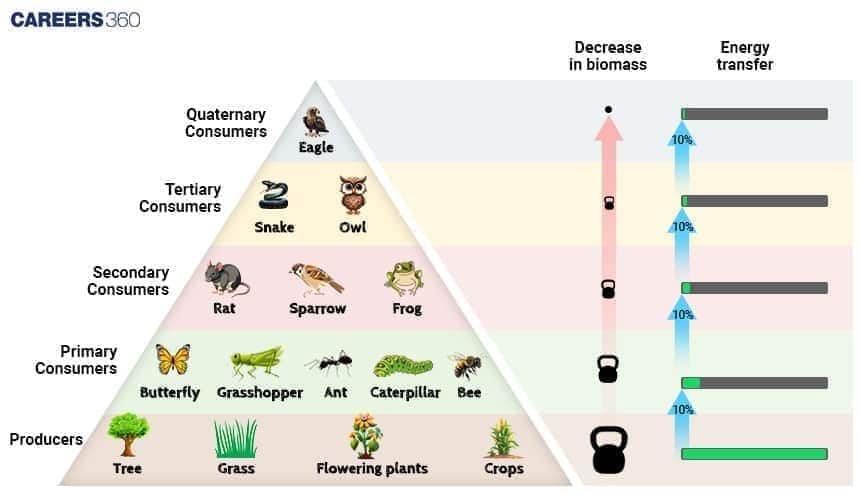
According to Lindeman's 10% law, only about 10% of energy is passed to the next trophic level. The rest is lost as heat during metabolic processes.
Ecological pyramids are of great importance to primary producers. It maintains the ecosystem balance and gives information on population dynamics. This helps in maintaining biodiversity and its conservation.
Types of Ecological Pyramids - Numbers, Biomass, Energy
There are three types of ecological pyramids in an ecosystem: the pyramids of numbers, the pyramids of biomass, and the pyramids of energy. Each type of ecological pyramid gives a different vision of the structure and energy flow of an ecosystem. All three of them are discussed below:
| S.No. | Type of Pyramid | What It Shows | Describes |
|---|---|---|---|
1 | Pyramid of Numbers | Number of individual organisms at each trophic level | Indicates population size and decline at higher levels |
2 | Total dry mass (biomass) of organisms at each trophic level | Highlights the total living matter available on each level | |
3 | Pyramid of Energy | Flow of energy from producers to apex consumers across trophic levels | Shows energy efficiency and loss (as per the 10% law) |
Pyramid of Numbers in the Ecological Pyramid
A pyramid of numbers is a type of ecological pyramid that shows the number of individual organisms at each trophic level in an ecosystem. In most cases, the pyramid of numbers has an upright shape. The reason for its shape is due to the large number of producers at the base and a decrease at the high tropic level due to a smaller number of top-level predators. Basic types of the Pyramid of Numbers are discussed below:
Forest Ecosystem: Many small plants at the base, fewer herbivores like deer, and even fewer top predators like tigers.
Grassland Ecosystem: Many grasses, herbivores like rabbits and fewer predators like hawks.
Inverted Pyramid in Parasitic Food Chains: A tree with many birds that are parasitised by still more fleas.
Pyramid of Biomass: Upright and Inverted Forms
The pyramid of biomass is a type of ecological pyramid. It shows the total dry weight of all the organisms present at every trophic level in an ecosystem per unit area (usually in g/m² or kg/m²).
The biomass pyramid is usually upright in terrestrial ecosystems because the weight of producers (plants) is higher than that of the herbivores. It is higher than that of the carnivores. This pyramid of biomass model helps in the understanding of the amount of living organic matter on which higher trophic levels are supported.
Energy losses and biomass transfer inefficiencies are considerable according to ecological research, including that of Odum (1971). Only 10–20% of biomass moves to the next trophic level. The rest is lost in respiration, excretion, and decay.
In aquatic ecosystems, the pyramid of biomass may appear inverted. The biomass of phytoplankton (producers) is far smaller than that of zooplankton (primary consumers), even though it has a higher turnover rate. This inverted biomass pyramid is a key concept in NEET biology and is often asked in exams.
Pyramid of Energy: Always Upright in Ecosystem
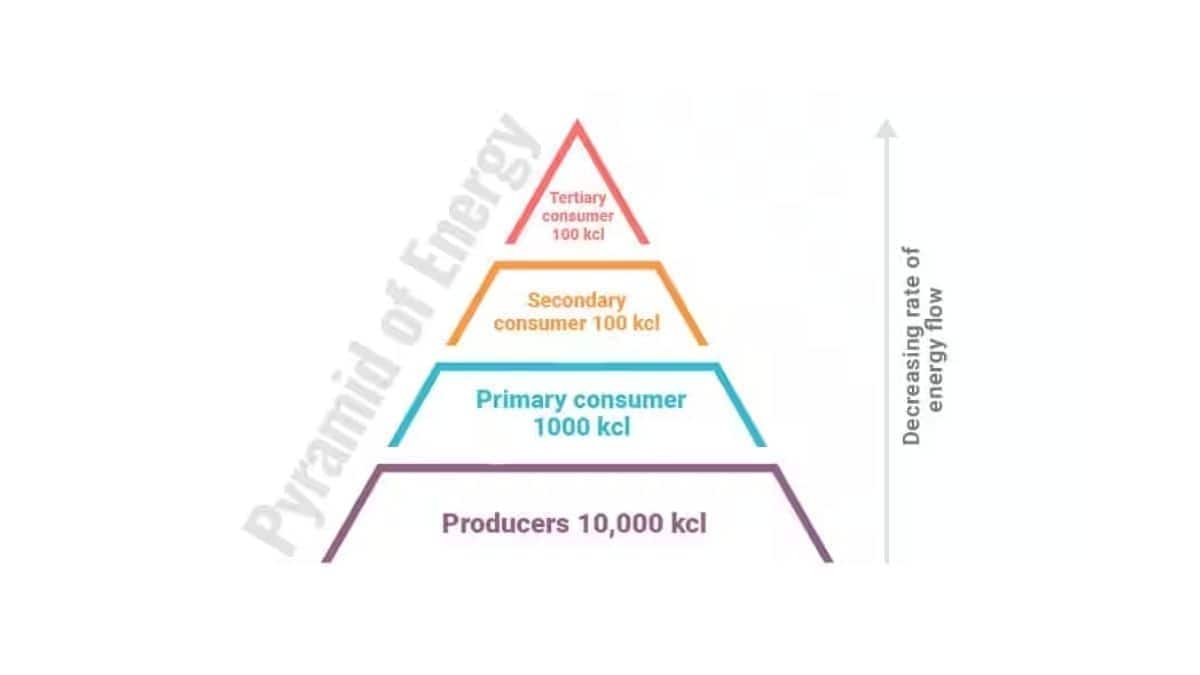
A pyramid of energy is a diagrammatic representation of the flow of energy through the trophic levels of an ecosystem over a given period. The pyramid of energy is always upright because energy decreases at each trophic level due to losses in respiration, heat, and metabolic activities.
The forest ecosystem may have a large input of energy at the base of the pyramid due to sunlight trapped by trees. This energy supports herbivores and carnivores at higher trophic levels, but the available energy declines sharply. The upright pyramid of energy clearly shows why top predators are fewer in number.
In an aquatic ecosystem, the pyramid of energy also remains upright. Producers like phytoplankton capture sunlight and form the base of the ecological pyramid. Energy transfer to zooplankton and higher consumers follows Lindeman’s 10% law, ensuring the pyramid of energy never inverts.
Comparison of Ecological Pyramids Types
The three types of ecological pyramids are the pyramid of numbers, the pyramid of biomass, and the pyramid of energy. These ecological pyramids differ in their representation of trophic levels. Each provides unique insights into ecosystem structure and function. The comparison of different types of pyramids is described below:
Aspect | Pyramid of Numbers | Pyramid of Biomass | Pyramid of Energy |
|---|---|---|---|
Definition | Represents the number of organisms at each trophic level | Represents the total dry mass of organisms at each trophic level | Represents the flow of energy through each trophic level over time |
Appearance | Can be upright or inverted, depending on the ecosystem structure | Usually upright in terrestrial ecosystems, but can be inverted in aquatic systems | Always upright due to the unidirectional flow of energy |
Limitation | Misleading, as it doesn't consider the size or biomass of organisms | Biomass can fluctuate seasonally, but it doesn’t account for the turnover rate | Difficult to measure only shows quantity, not the quality of energy |
Inversion Possibility | Yes – seen in parasitic food chains or ecosystems with many small organisms | Yes, especially in aquatic ecosystems where consumer biomass exceeds producer biomass | No energy flow follows the second law of thermodynamics and is always reduced at higher levels |
Accuracy | Less accurate – may not reflect actual energy or biomass contribution | More accurate than numbers, but still affected by time and environmental factors | Most accurate and informative in terms of ecosystem function |
Data Collection | Relatively easy – just count individuals | Moderate – requires measuring biomass, which varies with time | Difficult and time-consuming – requires measuring energy transfer rates |
Importance of Ecological Pyramids in Ecosystem Energy Flow
Ecological pyramids are a very important tool in ecology and EET biology. They explain the flow of energy, the distribution of biomass, and the population structure within the ecosystem. Each type of pyramid of numbers, pyramid of biomass, and pyramid of energy provides unique insights into how ecosystems function. They help in picturing the efficiency of energy transfer and identifying potential imbalances in ecosystem services.
The pyramid of numbers shows population size and decline at higher trophic levels.
The pyramid of biomass highlights the total living matter supporting consumers.
The pyramid of energy demonstrates the efficiency of energy transfer and why it is always upright.
Ecological Pyramid MCQs for NEET Biology
Question 1: In a grassland ecosystem, the base of the Pyramid of Numbers would most likely consist of:
Birds
Insects
Snakes
Trees
Correct Answer: 2) Insects
Explanation:
In a grassland ecosystem, the base of the Pyramid of Numbers is primarily formed by primary producers, which include grasses, herbaceous plants, and sometimes shrubs. These plants are the foundation of the ecosystem because they are the primary source of energy for all other organisms in the food web. Through the process of photosynthesis, primary producers capture solar energy and convert it into chemical energy, which is stored in the form of glucose and other organic molecules.
Hence, the correct answer is option 2) Insects.
Question 2: Which of the following factors can cause an inverted Pyramid of Biomass?
High rates of primary productivity.
Low rates of primary productivity.
Rapid growth of herbivores.
Increased competition among consumers.
Correct Answer: 2)Low rates of primary productivity.
Explanation:
Low rates of primary productivity can cause an inverted Pyramid of Biomass, where the biomass of the lower trophic level is higher than the biomass of the higher trophic level. This can occur in aquatic ecosystems where phytoplankton have a high rate of turnover and low biomass but are rapidly consumed by zooplankton, which have a lower rate of turnover but higher biomass.
Hence, the correct answer is option 2) Low rates of primary productivity.
Question 3: An inverted pyramid of biomass can be found in which ecosystem?
Forest
Marine
Grassland
Tundra
Correct Answer: 2) Marine
Explanation:
In marine ecosystems, the biomass pyramid is inverted because phytoplankton, though small, have a high turnover rate and are consumed quickly by larger organisms. Fish, which are much larger, accumulate more biomass despite consuming a lot of phytoplankton. As a result, the total biomass of fish is greater than that of the phytoplankton, creating an inverted pyramid.
Hence, the correct answer is option 2) Marine.
Question 4: If 20 J of energy is trapped at the producer level, then how much energy will be available to the peacock as food in the following chain? plant → mice→ snake →peacock
0.02 J
0.002 J
0.2 J
0.0002 J
Correct Answer: 1) 0.02 J
Explanation:
Pyramid of energy - The energy flows in an ecosystem from the producer level to the consumer level. - wherein at each trophic level, 80 to 90% of energy is lost. Hence, the amount of energy decreases from the producer level to the consumer level. This can be represented in a pyramid of energy levels to the consumer level. This can be represented in a pyramid of energy.
Hence, the correct answer is option 2) 0.02J
Recommended Video for Ecological Pyramids
Frequently Asked Questions (FAQs)
The 10% rule in ecological pyramids states that only about 10% of energy is transferred from one trophic level to the next, while the rest is lost as heat and metabolism. This explains the energy flow in ecosystems.
The concept of ecological pyramid was given by Charles Elton (1927), known as the father of animal ecology.
A pyramid of biomass can be inverted in aquatic ecosystems if the biomass of primary consumers at any time becomes quite high compared to the producers.
The three main types of ecological pyramids are the pyramid of numbers, pyramid of biomass, and pyramid of energy. Each represents different aspects of energy flow and organism distribution across trophic levels.
