

Impact Of The Internet Of Things On The Economy: A Mathematical Perspective
The world is experiencing a technological revolution like never before. One of the most significant advancements in recent times is the Internet of Things (IoT). IoT refers to the interconnected network of physical devices, vehicles, appliances, and other objects embedded with sensors, software, and network connectivity, enabling them to collect and exchange data. This technology can potentially revolutionise various industries and transform the global economy. In this article, we will explore the impact of IoT on the economy, focusing on its mathematical aspects.

Concepts discussed in this article are helpful for both general knowledge and competitive exams such as state boards, NEET, and JEE preparation. NCERT covers these concepts in different subjects; a few of them are given below.
Mathematics: Mathematical models, algorithms, and statistical analysis techniques applicable to IoT are covered in chapters related to statistics, probability, and linear programming in Class 12.
Computer Science: IoT concepts like sensors, data collection, and networking is covered in chapters related to computer networks, database management, and information systems.
Economics: The economic impact of technology, including IoT, is discussed in chapters on microeconomics or macroeconomics, particularly in sections exploring technological advancements and their effects on markets and productivity.
Therefore, let’s understand the IoT first.
Internet Of Things (IoT)
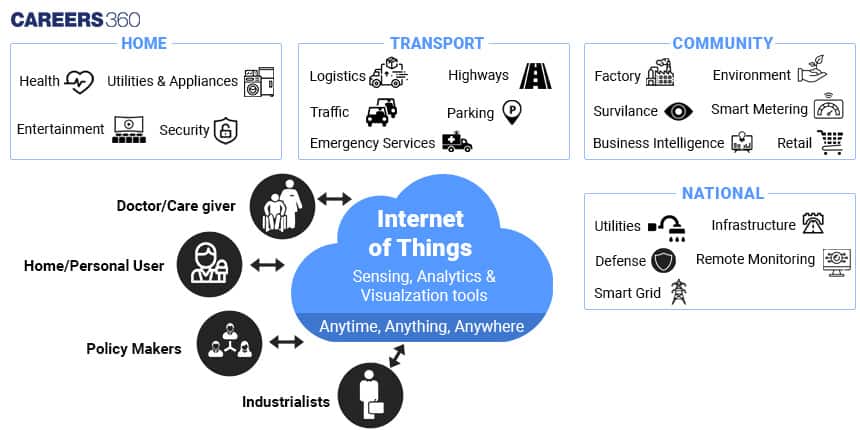
The Internet of Things (IoT) is a network of interconnected physical devices, vehicles, and objects embedded with sensors and software that enable them to collect and exchange data. These "smart" devices communicate with each other and with humans, providing real-time information and enabling automation and control. IoT has applications in numerous sectors, including healthcare, agriculture, transportation, manufacturing, and smart cities. By connecting the physical and digital worlds, IoT enhances efficiency, improves decision-making, and creates new opportunities for innovation and improved quality of life.
Mathematics And IoT
Probability And Statistics
Probability and statistics play crucial roles in IoT applications. IoT generates vast amounts of data, and understanding the probability distributions of sensor readings, network delays, or system failures can help in designing efficient algorithms for data processing, anomaly detection, and predictive maintenance. Statistical techniques such as regression or time series analysis can be employed to model and predict IoT data patterns.
Suppose you have a temperature sensor deployed in an IoT system. The sensor readings follow a normal distribution with a mean of 25°C and a standard deviation of 2°C. You want to determine the probability of observing a temperature reading between 22°C and 28°C.
Solution: To solve this problem, we can use the properties of the normal distribution and calculate the area under the curve between 22°C and 28°C.
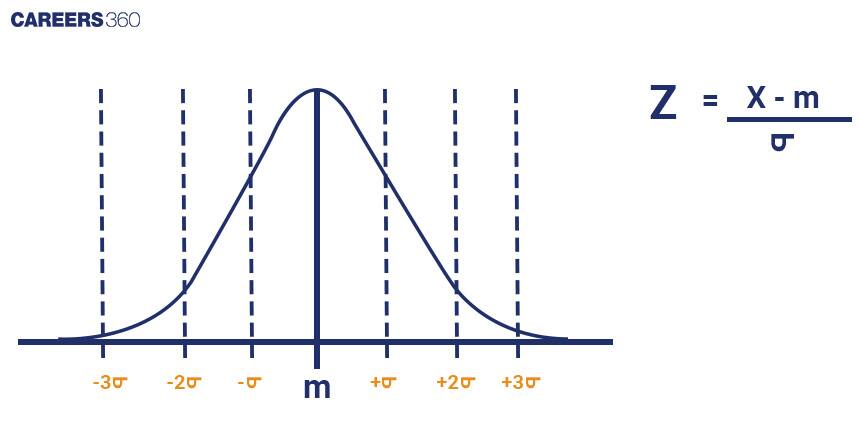
First, we standardise the values using the formula: Z = (X - μ) / σ
Where:
Z is the standard score, X is the value we want to standardise, μ is the mean of the distribution, and σ is the standard deviation.
Standardising the lower limit: Z1 = (22 - 25) / 2 = -1.5
Standardising the upper limit: Z2 = (28 - 25) / 2 = 1.5
Next, we look up the corresponding probabilities in the standard normal distribution table or use statistical software to find the area under the curve between -1.5 and 1.5. Let's assume the area is 0.866.
Therefore, the probability of observing a temperature reading between 22°C and 28°C is 0.866 or 86.6%.
Consider an IoT system that monitors air quality. The system collects data on pollutant levels (in parts per million, ppm) and the corresponding outdoor temperature (in Celsius). You want to determine the relationship between the pollutant levels and temperature using linear regression.
Solution: Regression analysis helps model the relationship between two variables. In this case, we can use a simple linear regression model.
Let's assume we have the following data:
Pollutant Levels (X): 10, 12, 9, 15, 13
Temperature (Y): 20, 22, 18, 24, 23
We can use the formula for linear regression to estimate the relationship between the variables:
Y = a + bX
Where Y is the dependent variable (temperature), X is the independent variable (pollutant levels), a is the intercept, and b is the slope of the regression line.
Using statistical software or spreadsheet tools, we can calculate the values of a and b to obtain the regression equation. Let's assume we obtain the following values:
a = 15.2
b = 0.9
The regression equation for predicting temperature based on pollutant levels would be:
Y = 15.2 + 0.9X
This equation allows us to estimate the temperature (Y) for a given pollutant level (X) in the IoT system.
Graph Theory
Graph theory is a branch of mathematics that deals with the study of graphs, which consist of nodes connected by edges. In IoT, nodes can represent devices or sensors, and edges can represent the connections or communication channels between them. Graph theory can be applied to analyse the connectivity patterns, network topologies, and optimization of data routing in IoT systems.
One famous problem in graph theory related to routing optimization is the Travelling Salesman Problem (TSP). The TSP seeks to find the shortest possible route that visits all nodes exactly once and returns to the starting node. In the context of IoT, solving the TSP using graph theory techniques can help find the best path for data transmission among devices, optimising energy consumption and reducing latency.
Cryptography
Cryptography is the study of secure communication techniques, while cryptology encompasses both cryptography and cryptanalysis (the study of breaking cryptographic systems). IoT systems often involve transmitting sensitive data over networks, making cryptography essential to ensure data confidentiality, integrity, and authenticity. Mathematical concepts such as encryption algorithms, digital signatures, and cryptographic protocols form the basis of secure IoT communication.
Impact Of IoT On The Economy
Enhanced Efficiency through Data Analytics
IoT devices generate an enormous amount of data every second. This data is a valuable resource for businesses as it provides insights into consumer behaviour, product performance, and operational efficiency. By leveraging mathematical models and statistical analysis, companies can extract meaningful patterns and trends from this data. For instance, analysing consumer preferences can help businesses optimise their product offerings and marketing strategies, leading to increased sales and improved profitability.
Predictive Maintenance and Cost Savings
Mathematics plays a crucial role in predictive maintenance, which is a significant application of IoT. By monitoring the performance of machines and equipment in real-time using IoT sensors, companies can detect potential failures or maintenance needs before they occur. This proactive approach helps minimise downtime, prevent costly breakdowns, and reduce repair and replacement expenses. Mathematical algorithms can analyse historical data and predict when maintenance is required, optimising resource allocation and saving money.
Supply Chain Optimisation
Efficient supply chain management is vital for businesses to meet customer demands promptly. IoT facilitates real-time tracking of inventory, monitoring of shipments, and optimisation of logistics. Mathematical models and algorithms are used to analyse data collected from IoT devices to optimise inventory levels, minimise transportation costs, and streamline the entire supply chain process. This optimization leads to reduced waste, improved customer satisfaction, and increased profitability.
Smart Energy Management
The IoT enables the creation of smart grids and intelligent energy management systems. By integrating IoT sensors into power grids and energy-consuming devices, it becomes possible to monitor energy usage patterns, identify inefficiencies, and make informed decisions for energy conservation. Mathematical models help analyse the collected data, optimise energy distribution, and predict energy demands accurately. This leads to improved energy efficiency, reduced carbon footprint, and substantial cost savings.
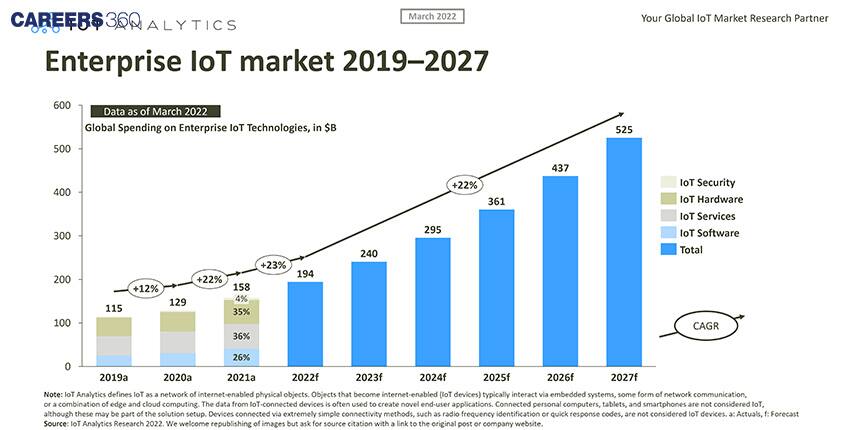
Mathematical models are utilised by Global IoT Analytics to forecast the economic impact and future growth of the Internet of Things (IoT), which can be visually represented in the graph provided below.
Now, you have a basic knowledge of how mathematics plays a crucial role in understanding the Internet of Things and its impact on the economy.
