

- Maths
- Relations and Functions
- Applications Of Linear Graphs
Applications Of Linear Graphs
We see variations in the values of various quantities in our daily lives as a result of variations in the values of various other quantities. In some cases, the value of one quantity rises when the value of the other quantity rises, while in other situations, the value of one quantity falls when the value of the other quantity rises. As a result, there might be either a direct proportion or an indirect proportion between the two quantities. The relationship between these two quantities can be shown graphically or arithmetically. Sometimes there is a linear relationship between these two numbers, which means that a change in one quantity's value is proportional to a change in the other quantity's value by a factor of k, where k is some constant.
This Story also Contains
- What Is A Linear Graph?
- Linear Graph Equation
- Real-Life Applications Of Linear Graphs
- Linear Graph Vs. Line Graph
- How To Plot Linear Equations On The Graph?
- Points To Remember
What Is A Linear Graph?
A straight line is what the word "linear" denotes. The linear graph is a straight line drawn on a plane with points where it intersects at x and y coordinates. It displays a two-variable linear equation and illustrates the linear relationship between two quantities. In daily life, linear equations are used, and a straight line is drawn on a plane to graph those relationships. A linear graph is a visual representation of a linear equation. It is a graph with straight lines connecting the points. This graph has two axes, the x-axis, and the y-axis.
Linear Graph Equation
A mathematical equation that explains the linear relationship between two variables is known as a linear graph equation. Based on the value of the other variable, the equation can be used to predict the value of one variable.
As we are aware, the linear graph represents the following equation as a straight line.
y=mx+b
Here, ‘m’ represents the slope or gradient of the line and ‘b’ represents the y-intercept.
The ratio of the difference between the y-coordinates and the x-coordinates of the two points on the straight line is known as the gradient or slope value.
m=\frac{y_{2}-y_{1}}{x_{2}-x_{1}}
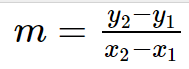
This can also be written as,
{y_{2}-y_{1}}=m({x_{2}-x_{1}})
![]()
The linear graph equation has the following form in standard form: Ax+By=C, where A, B, and C are real numbers.
Real-Life Applications Of Linear Graphs
Straight-line graphs can be used to explain potential contract markets and possibilities in the future.
A straight-line graph is used in both medicine and pharmacy to identify the precise strength of drugs.
In conducting research and creating the government budget, straight-line graphs are employed.
To determine whether our body weight is acceptable for our height, straight-line graphs are employed.
Recommended eBooks
Related eBooks and Sample Papers
Linear Graph Vs. Line Graph
Though line segments are the basic components of both line and linear graphs, there is a significant distinction between the two. The difference is that all of the points on a linear graph are collinear and, as a result, lie on a line. However, they might or might not be collinear in the case of a line graph.
How To Plot Linear Equations On The Graph?
To plot a linear equation on a graph, take into consideration the steps below:
Step 1: Determine the two changing quantities.
Step 2: Let x and y be the first and second quantities, respectively.
Step 3: The following step is to identify three ordered pairs (x, y) that fulfill the given equation.
Step 4: Create a table with these values in it.
Step 5: Make a cartesian plane plot using the table's points.
Step 6: Connect the points.
Points To Remember
Two pairs of (x,y) are all that are required to draw a linear graph. To make sure the solutions found for the specified linear equation are accurate, it is advisable to plot one additional point.
A line parallel to the X-axis, or a horizontal line, is represented by the equation y = kx (where k is a real number).
A line parallel to the Y-axis, or a vertical line, is represented by the equation x = ky (where k is a real number).
Frequently Asked Questions (FAQs)
A line parallel to the Y-axis, or a vertical line, is represented by the equation x = ky (where k is a real number).
The difference is that all of the points on a linear graph are collinear and, as a result, lie on a line. However, they might or might not be collinear in the case of a line graph.
A line parallel to the X-axis, or a horizontal line, is represented by the equation y = kx (where k is a real number).
The linear graph is a straight line drawn on a plane with points where it intersects at x and y coordinates. It displays a two-variable linear equation and illustrates the linear relationship between two quantities.
A linear relationship between these two numbers means that a change in one quantity's value is proportional to a change in the other quantity's value by a factor of 1.
5 Sep'25 - 31 Jul'26 (Online)
25 Oct'25 - 15 Jul'26 (Online)
11 Feb'26 - 18 Aug'26 (Online)
25 Feb'26 - 11 Aug'26 (Online)
9 Mar'26 - 4 Aug'26 (Online)

News and Notifications
Student Community: Where Questions Find Answers