

Line Spectra Of Hydrogen Atom
The line spectra of the hydrogen atom reveal distinct patterns of light emitted when electrons transition between energy levels within the atom. These spectral lines, unique to hydrogen, are crucial for understanding atomic structure and quantum mechanics. Observed as discrete lines in the emission spectrum, they provide evidence for the quantized nature of atomic energy levels. In real life, these spectral lines are foundational in fields such as astronomy, where they help identify the composition of distant stars and galaxies, and in spectroscopy, which aids in analyzing chemical compositions and developing new materials. By studying the hydrogen line spectra, we gain insights into atomic behaviour and advance various scientific and industrial applications. In this article, we will discuss the concept of the Line spectra of a Hydrogen atom and solve examples for better concept clarity.
This Story also Contains
- Line Spectra of a Hydrogen Atom
- Solved Examples Based on Line Spectra of the Hydrogen Atom
- Summary
Line Spectra of a Hydrogen Atom
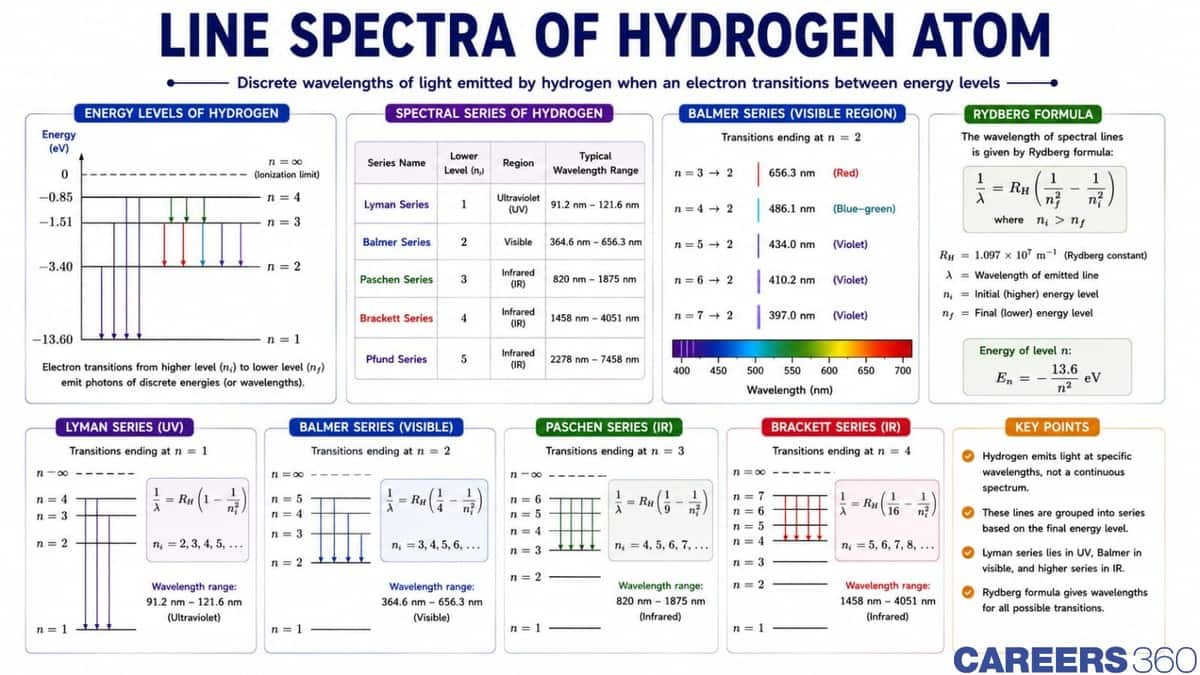
According to Bohr, when an atom makes a transition from a higher energy level to a lower energy level, it emits a photon with energy equal to the energy difference between the initial and final levels. If Ei, is the initial energy of the atom before such a transition, Ef is its final energy after the transition, then conservation of energy gives the energy of the emitted photon.
$
\begin{aligned}
& \mathrm{h} v=\frac{\mathrm{hc}}{\lambda}=E_i-E_{\mathrm{f}} \\
& \frac{h c}{\lambda}=\frac{-13.6}{n_i^2} \mathrm{eV}-\frac{-13.6}{n_f^2} \mathrm{eV}=13.6 \mathrm{eV}\left(\frac{1}{n_f^2}-\frac{1}{n_i^2}\right) \\
& R c h=13.6 \mathrm{eV}=1 \text { Rydberg energy } \\
& \Rightarrow \frac{1}{\lambda}=R\left(\frac{1}{n_f^2}-\frac{1}{n_i^2}\right)
\end{aligned}
$
where $R=$ Rydberg's constant $=1.097 \times 10^7 \mathrm{~m}^{-1}$
For Hydrogen-like atoms, the wavelength of an emitted photon during the transition from $\mathrm{n}_{\mathrm{f}}$ orbit to $n_i$ orbit is
$
\frac{1}{\lambda}=R z^2\left(\frac{1}{n_f^2}-\frac{1}{n_i^2}\right)
$
Because of this photon, spectra of hydrogen atoms will emit which are studied by various scientists. One such scientist named Balmer found a formula that gives the wavelengths of these lines for all the transitions taking place to the 2nd orbit.
The Balmer series is a series of spectral emission lines of the hydrogen atom that result from electron transitions from higher levels down to the energy level with principal quantum number 2
Balmer observed the spectra and found the formula for the visible range spectra which is obtained by Balmer's formula is-
$\frac{1}{\lambda}=R\left(\frac{1}{2^2}-\frac{1}{n^2}\right) \ldots$
Here, $n=3,4,5, \ldots \ldots$ etc.
$
R=\text { Rydberg constant }=1.097 \times 10^7 \mathrm{~m}^{-1}
$
and $\lambda$ is the wavelength of the light photon emitted during the transition.
Since Balmer had found the formula for n = 2, we can obtain different spectra for different values of n. For n = $\infty$, we get the smallest wavelength of this series, which is equal to = $3646 \dot{A}$. We can also obtain the value of wavelength for Balmer's series by putting different values of 'n' in the equation (1). Similarly, we can obtain the wavelength of the different spectra like the Lyman, and Paschen series. The Balmer series is in the visible range but the Lyman series is in the Ultraviolet range and the Paschen, Brackett, and Pfund are in the Infrared range.
Lyman series: $\frac{1}{\lambda}=R\left(\frac{1}{1^2}-\frac{1}{n^2}\right), n=2,3,4, \ldots$
Balmer series: $\frac{1}{\lambda}=R\left(\frac{1}{2^2}-\frac{1}{n^2}\right), n=3,4,5, \ldots$
Paschen series: $\frac{1}{\lambda}=R\left(\frac{1}{3^2}-\frac{1}{n^2}\right), n=4,5,6, \ldots$
Brackett series: $\frac{1}{\lambda}=R\left(\frac{1}{4^2}-\frac{1}{n^2}\right), n=5,6,7, \ldots$
Pfund series: $\frac{1}{\lambda}=R\left(\frac{1}{5^2}-\frac{1}{n^2}\right), n=6,7,8$ 

This is for the hydrogen spectrum
Recommended Topic Video
Solved Examples Based on Line Spectra of the Hydrogen Atom
Example 1: The ratio of the wavelengths of the first line of the Lyman series and the first line of the Balmer series is :
1) 1: 3
2) 27: 5
3) 5: 27
4) 4: 9
Solution:
$
\frac{1}{\lambda}=\mathrm{R}\left(\frac{1}{\mathrm{n}_1^2}-\frac{1}{\mathrm{n}_2^2}\right)
$
For the first line of the Lyman series $\mathrm{n}_1=1$ and $\mathrm{n}_2=2$
For the first line of the Balmer series $\mathrm{n}_2=2$ and $\mathrm{n}_2=3$
So, $\frac{\lambda_{\text {Lymen }}}{\lambda_{\text {Balmer }}}=\frac{5}{27}$
Example 2: The wavelength of the first line of the Balmer series is 6563 Å. The Rydberg constant for hydrogen is about :
1) $1.09 \times 10^7$ per m
2) $1.09 \times 10^8$ per m
3) $1.09 \times 10^9$ per m
4) $1.09 \times 10^5$ per m
Solution:
$\begin{aligned} & \frac{1}{\lambda}=\mathrm{R}\left[\frac{1}{4}-\frac{1}{9}\right]=\frac{5 \mathrm{R}}{36} \\ & \therefore \mathrm{R}=\frac{36}{5 \lambda}=\frac{36}{5 \times 6563 \times 10^{-10}}=1.09 \times 10^7 \mathrm{~m}^{-1}\end{aligned}$
Hence, the answer is the option (1).
Example 3: The ratio of the longest wavelength and the shortest wavelength observed in the five spectral series of the emission spectrum of hydrogen is
1) $\frac{4}{3}$
2) $\frac{525}{376}$
3) 25
4) $\frac{900}{11}$
Solution:
The shortest wavelength comes from $\mathrm{n}_1=\infty$ to $\mathrm{n}_2=1$ and the longest wavelength comes from $\mathrm{n}_1=6$ to $\mathrm{n}_2=5$ in the given case.
Hence
$
\begin{aligned}
& \frac{1}{\lambda_{\min }}=R\left(\frac{1}{1^2}-\frac{1}{\infty^2}\right)=R \\
& \frac{1}{\lambda_{\max }}=R\left(\frac{1}{5^2}-\frac{1}{6^2}\right)=\mathrm{R}\left(\frac{36-25}{25 \times 36}\right)=\frac{11}{900} \mathrm{R} \\
& \therefore \frac{\lambda_{\max }}{\lambda_{\min }}=\frac{900}{11}
\end{aligned}
$
Example 4: The extreme wavelengths of the Paschen series are:
1) $0.365 \mu \mathrm{m}$ and $0.565 \mu \mathrm{m}$
2) $0.818 \mu \mathrm{m}$ and $1.89 \mu \mathrm{m}$
3) $1.45 \mu \mathrm{m}$ and $4.04 \mu \mathrm{m}$
4) $2.27 \mu \mathrm{m}$ and $7.43 \mu \mathrm{m}$
Solution:
$\begin{aligned} & \text { In Paschen series } \frac{1}{\lambda_{\max }}=\mathrm{R}\left[\frac{1}{(3)^2}-\frac{1}{(4)^2}\right] \\ & \Rightarrow \lambda_{\max }=\frac{144}{7 \mathrm{R}}=\frac{144}{7 \times 1.1 \times 10^7}=1.89 \times 10^{-6} \mathrm{~m}=1.89 \mu \mathrm{m} \\ & \text { Similarly } \lambda_{\min }=\frac{9}{\mathrm{R}}=\frac{9}{1.1 \times 10^7}=0.818 \mu \mathrm{m}\end{aligned}$
Hence, the answer is the option (2).
Example 5: The third line of the Balmer series of an ion equivalent to a hydrogen atom has a wavelength of 108.5 mm. The ground state energy of an electron of this ion will be:
1) 3.4 eV
2) 13.6 eV
3) 54.4 eV
4) 122.4 eV
Solution:
For the third line of the Balmer series $\mathrm{n}_1=2, \mathrm{n}_2=5$
$
\therefore \frac{1}{\lambda}=R Z^2\left[\frac{1}{\mathrm{n}_1^2}-\frac{1}{\mathrm{n}_2^2}\right] \text { gives } \mathrm{Z}^2=\frac{\mathrm{n}_1^2 \mathrm{n}_2^2}{\left(\mathrm{n}_2^2-\mathrm{n}_1^2\right) \lambda \mathrm{R}}
$
On putting values $\mathrm{Z}=2$
From $E=-\frac{13.6 \mathrm{Z}^2}{n^2}=\frac{-13.6(2)^2}{(1)^2}=-54.4 \mathrm{eV}$
Hence, the answer is the option (3).
Summary
The line spectra of the hydrogen atom, characterized by discrete emission lines, arise from electrons transitioning between different energy levels. These spectral lines, including those in the Balmer, Lyman, and Paschen series, provide crucial evidence of quantized energy states within the atom. Real-life applications of this knowledge span from identifying chemical compositions in astronomy to practical uses in spectroscopy for material analysis. The study of hydrogen’s line spectra not only enhances our understanding of atomic structure but also drives technological advancements in various scientific fields.
