Download Careers360 App
Ellingham Diagram

Ellingham Diagram

Edited By Shivani Poonia | Updated on Jul 02, 2025 06:09 PM IST

The Ellingham diagram is an important aid that helps in the prediction of the temperatures needed when reducing metal oxides to pure metals, and, in so doing, assists metallurgists when deciding on the most effective way to extract it. Smelting is one of the earliest processes in history that consists of heating ore to high temperatures to recover metals by reduction with such agents as carbon. Meanwhile, in the Thermite Process, tremendous heat is liberated through possibly exothermic oxidation-reduction reactions between highly reactive metals such as aluminum with metal oxides.

This Story also Contains
  1. Ellingham Diagram
  2. Reduction of Oxides to Metal: Smelting
  3. Reduction by a More Electropositive Metal: Thermite Process
  4. Everyday Connection, Importance, and Applications
  5. Some Solved Examples
  6. Summary
Ellingham Diagram
Ellingham Diagram

Ellingham Diagram

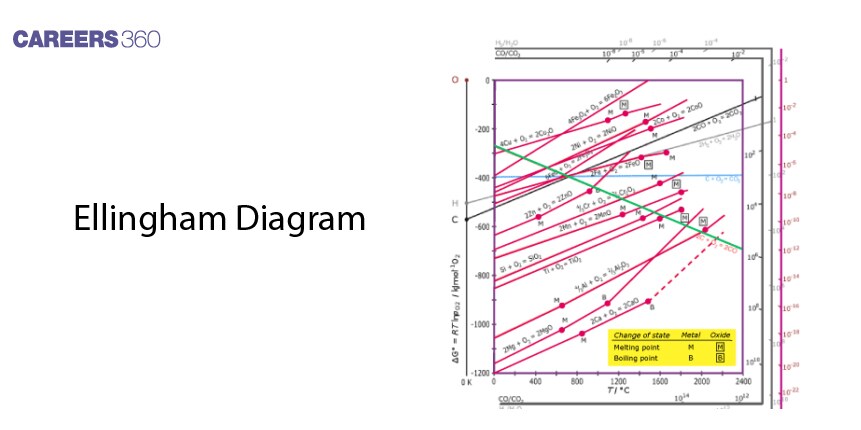
Consequently, the Ellingham diagram is of prime importance for metallurgists to understand the thermodynamic functionality of reduction of metal oxides. Geometrically, it is a plot of ΔG° for oxide formation against temperature. The lower the line is on the diagram, the more easily reducible the oxide is to its metal. Therefore, every plot is a straight line, which slopes upwards, showing the change in Gibbs free energy against temperature.

Function and Interpretation

The Ellingham diagram is a graph between temperature and the change in Gibbs free energy on the y-axis and x-axis, respectively. All the lines of various metal oxides indicate their stability with temperature. A very important point of the diagram would be where a line crosses the axis ΔG°=0, which gives the temperature above which an oxide will decompose spontaneously.

Limitations

While the Ellingham Diagram depicts the thermodynamic feasibility, it does not reveal information about the reaction kinetics. Furthermore, it is inferred assuming equilibrium conditions, which may significantly differ from reality, especially for heterogeneous processes that involve solids.

Reduction of Oxides to Metal: Smelting

Smelting Overview

Smelting is an old, now-replaced process for extracting metals from their ores through heating and melting. It is the reduction of metal oxides using a reducing agent like carbon or carbon monoxide.

Smelting Process

1. Pre-treatment of Ore: Ores are crushed and ground formally to liberate the metal-containing minerals.

2. Reduction: Pre-treated or prepared ore is charged into the furnace and heated with a reducing agent, thus reducing the metal oxide to molten metal.

3. Refinement: The molten metal is further refined to remove any impurities.

Example: Smelting in Tin

In tin, concentrated cassiterite ores of the form SnO2 are mixed with anthracite powder and powdered limestone

to give the following mixture. The heating of this mixture, usually in a reverberatory furnace, will reduce the ore to tin and the impurities combine with silica to be removed as calcium silicate (slag). The thus obtained tin is called black tin and is only 99.5% pure.[SnO2 + O2 ]

Reduction by a More Electropositive Metal: Thermite Process

Thermite Process Overview

The thermite process for reducing metal oxides involves making use of more electropositive metals like aluminum. This is an exothermic reaction so much heat is released and therefore has applications where high temperatures are sought.

Thermite Reaction

A typical thermite reaction involves aluminum powder and iron(III) oxide:

Fe2O3+2Al2Fe+Al2O3

Initially, this produces molten iron and aluminum oxide, with temperatures over 2500°C.

Applications

The Thermite Process is utilized in welding rail tracks, metal cutting, and fireworks because it produces high-intensity heat and light.

Everyday Connection, Importance, and Applications

Industrial Uses

1. Steel Production: Smelting and refining are an essential part of the manufacture of fine-quality steel that gets used in building and construction, automobiles, etc.

2. Electronics: Purifying metals like silicon and copper assures the manufacture of effective electronic components.

3. Welding and Repair: The Thermite Process is invaluable in the maintenance of railway tracks and other applications in welding using high temperatures.

Academic Significance

Very useful concepts in chemistry and material science, give some valuable insights into chemical reactions and thermodynamics, as well as into engineering and industry-based applications.

Recommended topic video on(Ellingham Diagram)

Some Solved Examples

Example 1
Question: What is the primary information represented by the Ellingham Diagram?

1. Change of \(\Delta H\) with temperature.
2. Change of \(\Delta G\) with pressure.
3. Change of (\(\Delta G - T\Delta S\)) with temperature.
4. Change of \(\Delta G\) with temperature.

Solution: The Ellingham Diagram represents the change in Gibbs free energy (\(\Delta G\)) with temperature for the formation of metal oxides. Hence, the correct answer is option 4.

Example 2
Question: With respect to an ore, what feasibility does the Ellingham Diagram help to predict?

1. Vapor phase refining.
2. Thermal reduction.
3. Zone refining.
4. Electrolysis.

Solution: The Ellingham Diagram helps to predict the feasibility of the thermal reduction of an ore. Hence, the correct answer is option 2.

Example 3
Question: Which metal cannot be extracted by the smelting process?

1. Zn
2. Cr
3. Pb
4. Fe

Solution: Chromium (Cr) cannot be extracted by the smelting process as it is more reactive and cannot be reduced by carbon or coke. Hence, the correct answer is option 2.

Example 4
Question: What is the purpose of smelting an ore?

1. To oxidize it.
2. To reduce it.
3. To separate volatile impurities.
4. To obtain an alloy.

Solution: The purpose of smelting an ore is to reduce the metal oxide to its pure metal form. Hence, the correct answer is option 2.

Example 5
Question: Which process is used for joining broken pieces of heavy iron objects like girders and railway tracks?

1. Hall-Heroult process.
2. Calcination process.
3. Thermite Process.
4. Mond process.

Solution: The Thermite Process is used for joining broken pieces of heavy iron objects, such as girders and railway tracks, through a highly exothermic reaction. Hence, the correct answer is option 3.

Summary

Ellingham Diagram, Smelting, and the Thermite Process are very cardinal subjects in the extraction of metals and their purification. The Ellingham Diagram predicts the feasibility of reduction, whereas smelting and the Thermite Process are standard techniques to perform the extraction and purification. These have wide applications in industries and thus are critical in order to land a job in both chemistry and metallurgy, as well as to be counted amongst the professionals.

Frequently Asked Questions (FAQs)

1. What is the Ellingham Diagram?

The Ellingham diagram provides a graphical plot in which information about the free energy change of metal oxide formation, and thus, can be defined the graph as a function of temperature with the temperatures at which metal oxides are capable of reduction to pure metal.

2. On the process of smelting

Smelting refers to the process of heating and melting alongside ores performed onto a reducing agent for obtaining pure metal. The process includes the preparation of the ores, reduction within the furnace, and then the purification of the molten metal.

3. Define Thermite Process.

It is the exothermic reaction in which one metal is more electropositive, including aluminum, used to remove the oxide of a less electropositive metal such that pure metal leaves behind. The process finds valuable applications that use very high temperatures like in welding, metal cutting, and so on.

4. What is an Ellingham diagram? For what purpose is it important in metallurgy?

An Ellingham Diagram is used by metallurgists to choose the best-suited reduction techniques, due to its prediction ability to check the feasibility of reactions, using a temperature and changes in Gibbs free energy.

5. Uses of smelting furnace and Thermite Process

The output from the smelting furnace has applications in structural works, electronics, and for many manufacturing industries. The products of the thermite process are very useful in welding, cutting metals at high temperatures, and pyrotechnics-related things.

6. What is an Ellingham diagram?
An Ellingham diagram is a graphical representation that shows the stability of metal oxides over a range of temperatures. It plots the standard Gibbs free energy change (ΔG°) for the formation of metal oxides against temperature, helping to predict the feasibility of reducing metal oxides to pure metals.
7. How do you interpret the lines on an Ellingham diagram?
The lines on an Ellingham diagram represent the stability of metal oxides. Lower lines indicate more stable oxides, while higher lines represent less stable oxides. The position of a metal's line relative to others helps predict which metals can reduce other metal oxides.
8. What does the slope of a line in an Ellingham diagram indicate?
The slope of a line in an Ellingham diagram represents the entropy change (ΔS°) for the oxidation reaction. A steeper negative slope indicates a larger increase in entropy, while a less steep or positive slope suggests a smaller change or decrease in entropy.
9. Why do most lines in an Ellingham diagram slope upwards?
Most lines in an Ellingham diagram slope upwards because the stability of metal oxides generally decreases with increasing temperature. This is due to the increase in entropy as temperature rises, making the oxidation reaction less favorable at higher temperatures.
10. What does the y-axis of an Ellingham diagram represent?
The y-axis of an Ellingham diagram represents the standard Gibbs free energy change (ΔG°) for the formation of metal oxides. More negative values indicate more stable oxides, while less negative or positive values represent less stable oxides.
11. Why are Ellingham diagrams important in metallurgy?
Ellingham diagrams are crucial in metallurgy because they help determine the conditions required for metal extraction from ores. They allow metallurgists to predict which reducing agents will be effective at different temperatures, optimizing the extraction process and making it more efficient and cost-effective.
12. How can Ellingham diagrams be used to choose appropriate reducing agents for metal extraction?
Ellingham diagrams help choose reducing agents by comparing the stability of different metal oxides. A suitable reducing agent will have a line above the metal oxide to be reduced at the operating temperature. This ensures the reduction reaction is thermodynamically favorable.
13. What is the significance of the intersection points in an Ellingham diagram?
Intersection points in an Ellingham diagram indicate temperatures at which the stability of two metal oxides is equal. Above this temperature, the relative stability of the oxides changes, which can affect the choice of reducing agents or extraction methods in metallurgical processes.
14. Why is water vapor sometimes included in Ellingham diagrams?
Water vapor is included in Ellingham diagrams because it can act as an oxidizing agent at high temperatures. Its line helps predict whether a metal will be oxidized by steam, which is important in processes involving high-temperature steam environments.
15. How do Ellingham diagrams explain why some metals are found in their native state in nature?
Ellingham diagrams show that metals with oxide lines near the top (less negative ΔG°) are less likely to form stable oxides. These metals, such as gold and silver, are often found in their native state because their oxides are unstable under normal environmental conditions.
16. How can Ellingham diagrams be used to predict the products of a reaction between a metal and another metal's oxide?
To predict reaction products using an Ellingham diagram, compare the positions of the metal lines. If metal A's line is above metal B's oxide line at a given temperature, metal A can reduce metal B's oxide. The products would be metal B and metal A's oxide.
17. How can you use an Ellingham diagram to predict if a metal can reduce another metal's oxide?
To predict if a metal can reduce another metal's oxide, compare their lines on the Ellingham diagram. If the reducing metal's line is higher (less negative ΔG°) than the metal oxide to be reduced, the reduction is thermodynamically favorable, and the reaction can occur.
18. How do Ellingham diagrams help in understanding the concept of selective reduction?
Ellingham diagrams aid in understanding selective reduction by showing the relative stability of different metal oxides. This allows for the identification of conditions where one metal oxide can be reduced while others remain stable, enabling the selective extraction of specific metals from mixed ores.
19. What is the importance of the hydrogen line in Ellingham diagrams?
The hydrogen line in Ellingham diagrams is important because hydrogen is a powerful reducing agent. Its position relative to other metal oxide lines helps predict which oxides can be reduced by hydrogen at different temperatures, which is crucial for processes like direct reduction of iron ore.
20. What does it mean when two lines are close together on an Ellingham diagram?
When two lines are close together on an Ellingham diagram, it indicates that the oxides have similar stability. Small changes in temperature or other conditions could easily change which oxide is more stable, making the reduction reaction between them sensitive to these factors.
21. What role does the carbon line play in Ellingham diagrams for metallurgy?
The carbon line in Ellingham diagrams is crucial for metallurgy as carbon is a common reducing agent. It helps determine the temperature at which carbon can reduce various metal oxides, which is particularly important in processes like the extraction of iron in blast furnaces.
22. What is the significance of the CO/CO2 line in Ellingham diagrams?
The CO/CO2 line in Ellingham diagrams represents the equilibrium between carbon monoxide and carbon dioxide. It's important for understanding the reducing power of carbon monoxide at different temperatures and helps in optimizing processes like iron smelting in blast furnaces.
23. Why is carbon monoxide often included in Ellingham diagrams?
Carbon monoxide is included in Ellingham diagrams because it's a common and effective reducing agent in metallurgy. Its line on the diagram helps determine at which temperatures it can reduce various metal oxides, making it valuable for planning metal extraction processes.
24. How can Ellingham diagrams be used to predict the maximum temperature for a metal extraction process?
Ellingham diagrams can predict the maximum temperature for metal extraction by identifying the point where the reducing agent's line intersects with the metal oxide's line. Above this temperature, the reduction becomes thermodynamically unfavorable, setting an upper limit for the process.
25. How do Ellingham diagrams help in understanding the concept of thermal decomposition of metal oxides?
Ellingham diagrams show that at very high temperatures, some metal oxide lines cross the oxygen line. This intersection point indicates the temperature at which the metal oxide will thermally decompose into the metal and oxygen gas without the need for a reducing agent.
26. How does the x-axis of an Ellingham diagram differ from other graphs?
The x-axis of an Ellingham diagram represents temperature, but unlike most graphs, it increases from right to left. This unconventional orientation allows for easier interpretation of the diagram, as lower lines (more negative ΔG°) represent more stable oxides.
27. How does the position of the oxygen line in an Ellingham diagram affect metal oxidation?
The oxygen line in an Ellingham diagram represents the stability of oxygen gas. Metals with oxide lines below the oxygen line will spontaneously oxidize in air, while those above the oxygen line are thermodynamically stable against oxidation at that temperature.
28. What is the significance of the "free energy of formation is zero" line in an Ellingham diagram?
The "free energy of formation is zero" line in an Ellingham diagram represents the point at which a metal and its oxide are in equilibrium. Above this line, the metal is stable, while below it, the metal oxide is stable. This line helps predict the direction of reactions at different temperatures.
29. How do Ellingham diagrams account for changes in the physical state of metals?
Ellingham diagrams show changes in the physical state of metals (e.g., melting or boiling) as kinks or discontinuities in the lines. These changes affect the entropy of the system, causing a shift in the slope of the line at the transition temperature.
30. Why are noble metals like gold and silver found at the top of Ellingham diagrams?
Noble metals like gold and silver are found at the top of Ellingham diagrams because their oxides have very low stability (high positive ΔG°). This explains why these metals are found in their native state in nature and do not readily oxidize in air.
31. Why do some lines in Ellingham diagrams have sudden changes in slope?
Sudden changes in slope in Ellingham diagrams often indicate phase transitions, such as melting or boiling of the metal or oxide. These transitions cause changes in entropy, affecting the Gibbs free energy and resulting in a change in the line's slope.
32. How do Ellingham diagrams account for the partial pressure of oxygen in the system?
Ellingham diagrams typically assume a standard oxygen partial pressure of 1 atm. However, they can be adjusted for different oxygen partial pressures by shifting the oxygen line. This allows for more accurate predictions in systems with varying oxygen concentrations.
33. Why are some metal oxide lines on Ellingham diagrams not straight?
Some metal oxide lines on Ellingham diagrams are not straight due to changes in the heat capacity of the substances involved, phase transitions, or changes in reaction mechanisms at different temperatures. These factors affect the Gibbs free energy change, resulting in curved or kinked lines.
34. How do Ellingham diagrams explain why some metals form protective oxide layers?
Ellingham diagrams show that for some metals, like aluminum, the oxide line is very low (highly negative ΔG°). This indicates a very stable oxide that forms quickly on the metal surface. This stable oxide layer protects the underlying metal from further oxidation, explaining the phenomenon of passivation.
35. Why are Ellingham diagrams useful in predicting the outcome of displacement reactions between metals and metal oxides?
Ellingham diagrams are useful for predicting displacement reactions because they show the relative stability of metal oxides. If metal A's line is above metal B's oxide line at a given temperature, metal A can reduce metal B's oxide, displacing metal B from its compound.
36. How do Ellingham diagrams help in understanding the concept of carbon reduction of metal oxides?
Ellingham diagrams show the temperature dependence of carbon's reducing power. By comparing the carbon line with metal oxide lines, one can determine at which temperatures carbon can effectively reduce specific metal oxides, which is crucial in processes like iron and steel production.
37. What does the spacing between lines in an Ellingham diagram indicate about the relative reactivity of metals?
The spacing between lines in an Ellingham diagram indicates the difference in reactivity between metals. Metals with lines close together have similar reactivities, while those far apart have very different reactivities. This helps in predicting which metals will react more readily with oxygen or other oxidizing agents.
38. How can Ellingham diagrams be used to explain why some metals require electrolysis for extraction?
Ellingham diagrams show that some metals, like aluminum, have very stable oxides (low lines on the diagram). These oxides cannot be reduced by common reducing agents at any practical temperature. For such metals, electrolysis is required for extraction, as it provides the necessary energy to overcome the strong metal-oxygen bond.
39. Why is it important to consider kinetic factors alongside Ellingham diagrams in real-world applications?
While Ellingham diagrams provide thermodynamic information, they don't account for kinetic factors like reaction rates or activation energies. In real-world applications, a reaction that is thermodynamically favorable might still proceed slowly or not at all due to kinetic barriers, making it important to consider both aspects.
40. How do Ellingham diagrams help in understanding the concept of galvanic corrosion?
Ellingham diagrams can help understand galvanic corrosion by showing the relative nobility of different metals. Metals with oxide lines higher on the diagram are more noble and less likely to corrode, while those with lower lines are more reactive and prone to corrosion when in contact with a more noble metal in an electrolyte.
41. What is the significance of the standard state in Ellingham diagrams?
The standard state in Ellingham diagrams (usually 1 atm pressure for gases and pure solid or liquid for condensed phases) provides a consistent reference point for comparing different reactions. This allows for accurate predictions of reaction feasibility under standard conditions, which can then be adjusted for non-standard conditions.
42. How can Ellingham diagrams be used to predict the behavior of metals in different atmospheres?
Ellingham diagrams can predict metal behavior in different atmospheres by comparing the metal's oxide line with the lines representing various gas equilibria (e.g., H2/H2O, CO/CO2). This helps determine whether a metal will oxidize or remain stable in specific gaseous environments at different temperatures.
43. Why are some metals, like copper, easier to extract from their ores compared to others, like aluminum?
Ellingham diagrams show that copper's oxide line is relatively high, indicating a less stable oxide. This means copper oxide can be reduced by common reducing agents like carbon at moderate temperatures. In contrast, aluminum's oxide line is very low, indicating a highly stable oxide that requires more energy-intensive methods like electrolysis for extraction.
44. How do Ellingham diagrams help in understanding the concept of metal purification by zone refining?
While Ellingham diagrams don't directly address zone refining, they provide insights into the relative stability of metal oxides. This information can be useful in understanding why some impurities are more easily oxidized and removed during zone refining processes, contributing to metal purification.
45. What is the significance of the "Richardson line" in Ellingham diagrams?
The Richardson line in Ellingham diagrams represents the equilibrium between carbon and carbon monoxide. It's significant because it helps determine the conditions under which carbon can reduce metal oxides via the formation of CO, which is crucial in many metallurgical processes, especially in iron and steel production.
46. How can Ellingham diagrams be used to explain the reactivity series of metals?
Ellingham diagrams correlate well with the reactivity series of metals. Metals with oxide lines lower on the diagram (more negative ΔG°) are more reactive and appear higher in the reactivity series. This is because they form more stable oxides and are more likely to displace less reactive metals from their compounds.
47. Why is it important to consider the scale of Ellingham diagrams when interpreting them?
The scale of Ellingham diagrams is crucial for accurate interpretation. The y-axis typically spans hundreds of kJ/mol, so small differences between lines can represent significant differences in oxide stability. Failing to consider the scale might lead to incorrect conclusions about the relative stability of different metal oxides.
48. How do Ellingham diagrams help in understanding the concept of metal recycling?
Ellingham diagrams provide insights into the energy required to convert metals back to their oxides and vice versa. This information is valuable in metal recycling processes, helping to determine the most energy-efficient methods for recovering metals from their oxidized forms in waste materials.
49. What is the significance of the Boudouard reaction in Ellingham diagrams?
The Boudouard reaction (C + CO2 ⇌ 2CO) is represented on Ellingham diagrams and is significant in metallurgy, especially in iron production. It shows the temperature dependence of the equilibrium between carbon, carbon monoxide, and carbon dioxide, which affects the reducing power of carbon in high-temperature processes.
50. How can Ellingham diagrams be used to predict the formation of non-oxide compounds like sulfides or chlorides?
While Ellingham diagrams typically show metal oxides, the same principles can be applied to other compounds like sulfides or chlorides. Similar diagrams can be constructed for these compounds, allowing predictions about their formation and stability under various conditions.
51. Why is it important to consider the presence of complex oxides when using Ellingham diagrams?
Ellingham diagrams usually show simple metal oxides, but in reality, complex oxides (like spinels or mixed oxides) can form. These complex oxides may have different stabilities than predicted by the simple oxide lines, which can affect the accuracy of predictions based solely on the diagram.
52. How do Ellingham diagrams help in understanding the concept of metal passivation?
Ellingham diagrams show that some metals (like aluminum) form very stable oxides (low lines on the diagram). This explains metal passivation, where a thin, stable oxide layer forms on the metal surface, protecting it from further oxidation. The high stability of the oxide prevents continuous corrosion of the underlying metal.
53. What is the significance of the "temperature of inversion" in Ellingham diagrams?
The temperature of inversion in Ellingham diagrams is the point where two metal oxide lines cross. At this temperature, the relative stability of the two oxides changes. This concept is important in metallurgy as it can indicate a change in the preferred reduction method or the feasibility of certain extraction processes at different temperatures.
54. How can Ellingham diagrams be used to predict the behavior of alloys?
While Ellingham diagrams primarily deal with pure metals, they can provide insights into alloy behavior

Articles

Back to top