

Oxygen Dissociation Curve: Definition, Function And Examples
The oxygen dissociation curve explains how haemoglobin binds and releases oxygen under different physiological conditions. It shows the relationship between oxygen partial pressure and haemoglobin saturation. It is a sigmoid curve due to cooperative binding of oxygen. This curve explains how haemoglobin loads oxygen in the lungs and unloads it in tissues. Understanding ODC(oxygen dissociation curve) is crucial for the NEET Biology, nursing, physiology, and respiratory system chapters.
This Story also Contains
- Definition of Oxygen Dissociation Curve
- Oxygen Binding and Haemoglobin Affinity
- Key Factors Influencing the Oxygen Dissociation Curve
- Shifts in the Oxygen Dissociation Curve
- P50 Value and Oxygen Affinity
- Physiological and Pathological Relevance of Oxygen Dissociation Curve
- Oxygen Dissociation Curve NEET MCQs (With Answers & Explanations)
- Recommended video for Oxygen Dissociation Curve
The function of the oxygen dissociation curve is to show factors affecting haemoglobin affinity. pH, CO2, temperature, and 2,3‑BPG shift the curve. The Bohr effect explains rightward shifts, while the fetal haemoglobin curve shows leftward shifts. These oxygen dissociation curve examples are important for exam notes and quick revision. The oxygen dissociation curve (ODC) is central to the chapter Breathing and Exchange of Gases. It explains how haemoglobin binds oxygen in the lungs and releases it in tissues.
Definition of Oxygen Dissociation Curve
The oxygen dissociation curve is central to describing how oxygen is associated with and discharged from haemoglobin in the blood. The theory related to this curve goes on to explain how, effectively, oxygen is supplied to tissues in our body and how carbon dioxide is removed.
Oxygen Binding and Haemoglobin Affinity
The basics of oxygen binding are discussed below:
Haemoglobin Structure & Function
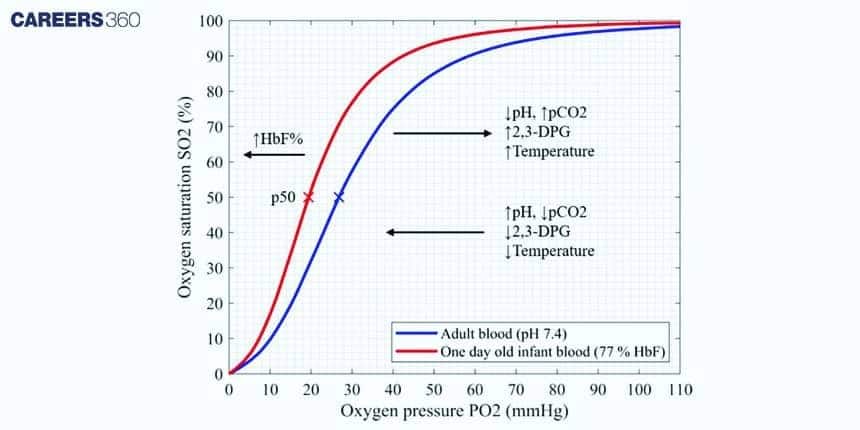
Heme is a protein in the red blood cells that carries oxygen from the lungs to body tissues. The relationship between oxygen partial pressure (pO2) and haemoglobin saturation is represented in the oxygen dissociation curve graph.
Cooperative Binding
Haemoglobin binds oxygen cooperatively. The binding of one oxygen molecule increases the affinity of the remaining sites, making oxygen loading easier. This cooperative nature gives the oxygen dissociation curve its sigmoid shape, ensuring efficient oxygen transport.
Key Factors Influencing the Oxygen Dissociation Curve
The oxygen dissociation curve is affected by several physiological and biochemical factors. These factors alter the respiratory system's haemoglobin’s affinity for oxygen, shifting the curve either to the right or to the left. The factors affecting the oxygen dissociation curve are:
Partial pressure of oxygen (pO2)
This exerts the most marked influence on the curve. High pO2 in the lungs favours haemoglobin binding to oxygen, and values of low pO2 favour the release of oxygen in tissues.
pH (Bohr Effect)
A decrease in pH means an increase in hydrogen ion concentrations—caused a decrease in affinity as P50 increased. Hence, shifting the curves to the right is referred to as the Bohr effect.
Carbon dioxide levels
Higher amounts of CO2 will shift the pH further right. Thus, less binding with the oxygen is allowed by haemoglobin—meaning that then more oxygen is released.
Temperature
The curve shifts rightward as temperature increases. This has the effect of lowering haemoglobin's affinity for oxygen.
2,3-Bisphosphoglycerate (2,3‑BPG)
This is a molecule that binds with haemoglobin to decrease its affinity for oxygen. The net effect of this binding would be a shift to the right, favouring increased delivery of oxygen to tissues.
Shifts in the Oxygen Dissociation Curve
The oxygen dissociation curve (ODC) shifts under different physiological conditions. These shifts change haemoglobin’s affinity for oxygen and directly affect the human respiratory system's oxygen delivery to tissues. The shift in the oxygen dissociation curve is discussed below:
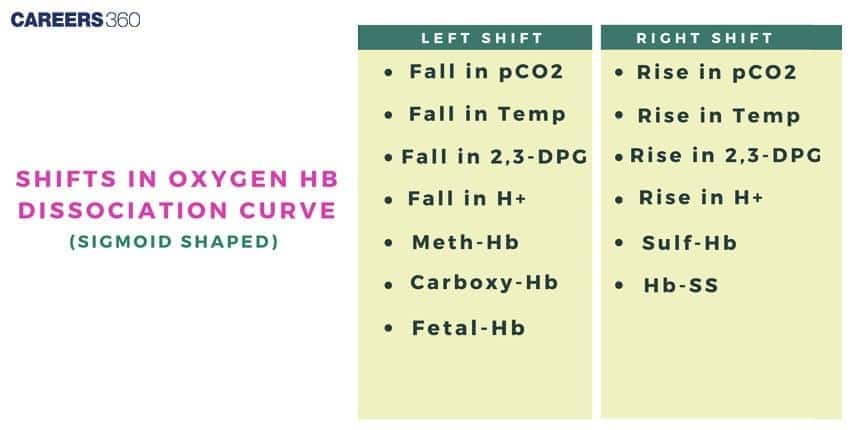
Right Shift (↓ affinity, ↑ O2 delivery)
Less haemoglobin affinity for oxygen. Hence, there will be an improved potential to give off oxygen to the tissues. Increased scavenging due to increased pCO2, higher temperatures, decreased pH and increased 2,3-BPG.
Left Shift (↑ affinity, ↓ O2 delivery)
A decreased affinity of haemoglobin to oxygen means a further enhancement in the ability of haemoglobin to give up oxygen to the tissues. This may happen with an increased pCO2, increased temperature, decreased pH, and increased 2,3-BPG.
P50 Value and Oxygen Affinity
The P50 value is the partial pressure of oxygen (pO2) at which haemoglobin is 50% saturated. It is a key indicator of haemoglobin’s affinity for oxygen.
High P50 Value: Indicates lower affinity. This corresponds to a right shift of the oxygen dissociation curve, promoting oxygen release to tissues.
Low P50 Value: Indicates higher affinity. This corresponds to a left shift of the curve, favouring oxygen loading in the lungs.
The P50 measurement is widely used in respiratory physiology, clinical diagnosis, and NEET exam notes to assess haemoglobin function and oxygen delivery efficiency.
Physiological and Pathological Relevance of Oxygen Dissociation Curve
The oxygen dissociation curve (ODC) has direct importance in respiration, exercise, and disease. It explains how haemoglobin adapts to different conditions for efficient oxygen transport. The physiological relevance of the oxygen dissociation curve is discussed below:
Oxygen Loading in Lungs
An elevated pO2 ensures optimum loading of oxygen onto the haemoglobin of the lungs.
Oxygen Unloading in Tissues
Low pO2 synergises with other tissue factors to allow the offloading of oxygen from the Hb molecule, most effectively delivering it.
Adaptations
There are shifts in the oxygen-dissociation curve, as needed, to enable physical changes to adapt efficiently to the physical change for efficient transfer of oxygen, such as at high altitudes or during exercise.
Pathological Relevance
Carbon monoxide binds much more firmly to haemoglobin than oxygen and therefore decreases its oxygen-carrying capacity, shifting the curve to the left.
Abnormal haemoglobin of sickle cell anaemia shall direct an abnormal oxygen dissociation curve and hence affect the delivery of oxygen.
Oxygen Dissociation Curve NEET MCQs (With Answers & Explanations)
Important topics for NEET are:
Factors affecting the oxygen dissociation curve
Shifts in the oxygen dissociation curve
Practice Questions for NEET
Q1. At high temperatures, the Hb will be less likely to stick to the oxygen and release it into the tissues, this causes the oxygen dissociation curve to shift to
Left
Right
No movement
Slightly left then right
Correct answer: 2) Right
Explanation:
DPG (2,3-diphosphoglycerate) and temperature both shift the oxygen dissociation curve to the right, promoting oxygen release from haemoglobin to tissues. DPG binds to haemoglobin, reducing its affinity for oxygen, especially at lower oxygen concentrations. Increased temperature also decreases haemoglobin's affinity for oxygen, enhancing oxygen delivery during conditions like exercise or fever. These changes help tissues receive more oxygen when metabolic demand is high.
At high temperatures, the Hb will be less likely to stick to the oxygen and release it into the tissues. The curve shifts to the right when the temperature increases.
Hence, the correct answer is option 2) Right.
Q2. Read the following statements
STATEMENT i): the decrease in 2,3 DPG concentration within the red cell shifts the curve to the left.
STATEMENT ii): lower temperature causes a leftward shift in the oxygen dissociation curve.
Choose the correct option:
Statement (i) is correct and statement (ii) is incorrect
Statement (i) is incorrect and statement (ii) is correct
Both statements are wrong
Both statements are correct
Correct answer: 4) Both statements are wrong
Explanation:
Explanation of statement i) : Statement i) is correct because The position of the oxygen dissociation curve (ODC) is modulated by 2,3-diphosphoglycerate (2,3-DPG). Decreases in 2,3-DPG concentration within the red cell shift the curve to the left, whereas increases in concentration cause a shift to the right of the ODC.
Explanation of statement ii): Statement ii) is also correct because The effect of temperature on the curve is relatively straightforward. Oxygen unloading is favored at higher temperatures which will cause a rightward shift. On the other hand, lower temperatures will cause a leftward shift in the dissociation curve.
Hence, the correct answer is option 4) Both statements are correct.
Q3. Which of the following will shift the Oxygen dissociation curve to the left?
a) Increase hydrogen ions
b) Increase 2,3-DPG
c) Decrease CO2
d) Decrease Temperature
a and b
c and d
a and c
b and d
Correct answer: 2) c and d
Explanation:
Both of these elements would cause the oxygen dissociation curve to move to the left increasing haemoglobin's affinity for oxygen and its ability to hold onto oxygen.
Decrease in CO2: The blood becomes less acidic (pH rises) when CO2 levels are lower which raises haemoglobin's affinity for oxygen and causes the curve to move to the left.
Temperature decrease: The curve moves to the left as a lower temperature also improves haemoglobin's affinity for oxygen.
The oxygen dissociation curve is shifted to the right by increases in 2,3-DPG (b) a byproduct of metabolism and hydrogen ions (a) which raise blood acidity. Haemoglobin can more easily provide oxygen to tissues that require it as a result.
Hence, the correct answer is option 2) c and d.
Recommended video for Oxygen Dissociation Curve
Frequently Asked Questions (FAQs)
It is a graph showing the relation between partial pressure of oxygen (pO2) and haemoglobin saturation.
Increased carbon dioxide, lower pH, increased temperature, and increased 2,3-BPG all produce a rightward shift. Therefore, the rightward shift gives haemoglobin a lesser affinity for oxygen.
Changes in the oxygen affinity of haemoglobin due to changes in pH and carbon dioxide generally a shift to the right in the oxygen dissociation curve.
Because there is cooperative binding between the molecules of oxygen in haemoglobin, the binding of one molecule of oxygen increases the affinity for the binding of other molecules of oxygen.