Principle of UV Visible Spectroscopy - Explanation, FAQs

Principle of UV Visible Spectroscopy - Explanation, FAQs

Edited By Team Careers360 | Updated on Jul 02, 2025 04:49 PM IST

Principle of UV Visible Spectroscopy

The principle of UV spectroscopy or the UV-Visible Principle or UV Principle Spectroscopy is based on chemical compounds absorption of ultraviolet or visible light, which results in the formation of different spectra. The interaction of light and matter is the basis of spectroscopy. Excitation and de-excitation occur as matter absorbs light, resulting in the formation of a spectrum.

This Story also Contains
  1. Principle of UV Visible Spectroscopy
  2. What is UV-Vis Spectroscopy
  3. UV Vis Spectrophotometer

When matter absorbs ultraviolet light, the electrons inside it become excited. This leads them to move from a ground state (an energy state having a little amount of energy associated with it) to an excited state (an energy state with a relatively large amount of energy). It's worth noting that the difference between the energies of the electron's ground and excited states is always equal to the quantity of ultraviolet or visible energy it absorbs.

UV-visible (UV-Vis) spectroscopy is a widely utilized technique in many fields of science, including bacterial culture, drug identification, and nucleic acid purity checks and quantification, as well as beverage quality control and chemical research. This article will explain how UV-Vis spectroscopy works, how to assess the results, the technique's advantages and disadvantages, and some of its uses. UV spectroscopy Slideshare or UV visible spectroscopy slideshare. would be helpful for knowing the concept better.

Also read -

NEET Highest Scoring Chapters & Topics
This ebook serves as a valuable study guide for NEET exams, specifically designed to assist students in light of recent changes and the removal of certain topics from the NEET exam.
Download EBook

What is UV-Vis Spectroscopy

UV-Vis spectroscopy is an analytical technique that is used to analyse the wavelengths of UV light absorbed by a sample or transmitted through a sample by comparing using a reference sample. The sample composition provides information about the sample and its concentration.

Because this spectroscopy approach relies on the usage of light, we'll start with light's qualities.

The quantity of energy contained in light is inversely proportional to its wavelength. As a result, shorter light wavelengths carry more energy while longer wavelengths carry less. To promote electrons in a substance to a higher energy state, which we can detect as absorption, a precise quantity of energy is required. In a substance, electrons in different bonding environments require a varied amount of energy to promote them to a higher energy state. This is why different wavelengths of light are absorbed by different things.

The UV visible range from around 380 nm, which we perceive as violet, to 780 nm, which we perceive as red. UV light has wavelengths that are shorter than visible light, up to about 100 nm. As a result, light may be defined by its wavelength, which can be useful in UV-Vis spectroscopy for analyzing or identifying various compounds by locating the exact wavelengths that correlate to maximal absorbance.

UV Vis Spectrophotometer

UV spectroscopy instrumentation is shown below.
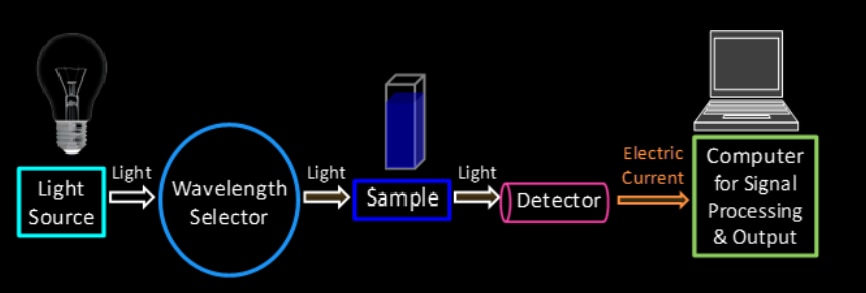
UV Visible spectrophotometer instrumentation

A UV spectrophotometer is the instrument used in ultraviolet–visible spectroscopy. It compares the intensity of light after it passes through a sample (I) to the intensity of light before it goes through a sample . The absorbance is the ratio of which is commonly given as a percentage (%T). The absorbance and A and transmittance is related by the following formula;

A = -log (%T/100%)

The reflectance can also be measured with the UV–visible spectrophotometer. The UV–visible spectrophotometer compares the intensity of light reflected from sample (I) with the light reflected from reference sample. Here the ratio is the reflectance and is represented as a percentage (%R).

The essential components of a UV-Vis spectrophotometer instrumentation are a light source, a diffraction grating in a monochromator or prism, and a sample holder.

Read more-

Also check-

NCERT Chemistry Notes:

Frequently Asked Questions (FAQs)

1. Explain the working of UV-vis spectrophotometer?

Light source:- A constant source capable of emitting light across a wide variety of wavelengths is required for this light-based technique. In both the UV and visible ranges, a single xenon lamp is widely utilized as a high-intensity light source. Xenon lamps, on the other hand, have higher costs and are less stable than tungsten and halogen lamps. A tungsten or halogen lamp is usually used for visible light, whereas a deuterium lamp is commonly used for UV light in devices with two lamps. The light source of the device must switch during measurement since two distinct light sources are required to scan both the UV and visible wavelengths. This switchover usually happens between 300 and 350 nm, when the light emission from both light sources is similar and the transition can be smoother.

*Wavelength selection:- From the wide range of wavelengths radiated by the light source, certain wavelengths relevant to the sample type and analyte for detection must be chosen for sample inspection. The methods used are described below;

(i) Monochromators- Light is separated into a small band of wavelengths by a monochromator. It is most commonly based on diffraction gratings that can be rotated to select the desired wavelength of light by changing the incoming and reflected angles.

(ii) Absorption filters- Colored glass or plastic absorption filters are often used to absorb specific wavelengths of light.

(iii) Interference filters- Also known as dichroic filters, are made up of numerous layers of dielectric material, with interference occurring between the thin layers of materials. These filters can be used as a wavelength selector by removing unwanted wavelengths through destructive interference.

(iii) Cutoff filters- It allows light to pass through either below (short pass) or above (long pass) a given wavelength. Interference filters are routinely used to achieve this.

(iv) Bandpass filters- Type of filter that allows a wide range of wavelengths to pass through and are made by combining short pass and long pass filters.

*Sample analysis:- The light then passes through a sample, regardless of whatever wavelength selector is utilised in the spectrophotometer. Measurement of a reference sample, is referred to as a blank sample. In a cuvette sometimes the same solvent is filled which is used to create the sample. When the sample is used for measurement, the reference is an aqueous buffered solution that does not include the substance of interest. The sterile culture media would be used as a reference while analysing bacterial cultures. The device then uses the reference sample signal to assist in obtaining the genuine absorbance values of the analytes.

*Detection:- After the light has gone through the sample, a detector converts the light into an electronic signal that can be analyzed. Detectors are often made of photoelectric coatings or semiconductors.

2. What are applications of UV-Vis spectroscopy?

UV-Visible spectroscopy is commonly employed in analytical chemistry, particularly for quantitative study of a single analyte. UV-Visible spectroscopy, for example, can be used to do quantitative analysis of transition metal ions. Furthermore, UV-Visible spectroscopy can be used to do quantitative examination of conjugated organic molecules. It should also be noted that in some circumstances, this sort of spectroscopy can be used on solid and gaseous analytes.

3. What is the UV range?

The visible spectrum ranges from 400 to 700 nm, while the UV ranges from 100 to 400 nm. Deep UV refers to the wavelength range of 100–200 nm.

4. What are the detectors used in UV-Vis spectroscopy?

The Photomultiplier tube is a common UV-Vis spectroscopy detector. A photo emissive cathode (a cathode that emits electrons when hit by radiation photons), multiple dynodes (a device that emits several electrons for each impacting electron), and an anode make up the device.

5. What is the basic principle behind UV-visible spectroscopy?
The basic principle of UV-visible spectroscopy is the absorption of light by molecules. When molecules are exposed to light in the ultraviolet or visible range, they absorb specific wavelengths of light corresponding to electronic transitions within the molecule. This absorption is measured and used to identify and quantify substances.
6. Why is UV-visible spectroscopy called "electronic spectroscopy"?
UV-visible spectroscopy is called "electronic spectroscopy" because it involves transitions of electrons between different energy levels within molecules. When a molecule absorbs light in the UV-visible range, electrons are excited from their ground state to higher energy levels, resulting in characteristic absorption spectra.
7. How does Beer-Lambert's law relate to UV-visible spectroscopy?
Beer-Lambert's law is fundamental to UV-visible spectroscopy. It states that the absorbance of a solution is directly proportional to the concentration of the absorbing species and the path length of the sample. This relationship allows for quantitative analysis of substances based on their light absorption.
8. What is a chromophore in the context of UV-visible spectroscopy?
A chromophore is a part of a molecule responsible for its color and light absorption in the UV-visible range. It typically consists of a system of conjugated double bonds or a metal complex. Examples include C=C, C=O, and N=N bonds, as well as aromatic rings.
9. How does UV-visible spectroscopy differ from infrared (IR) spectroscopy?
UV-visible spectroscopy measures electronic transitions in molecules, while IR spectroscopy detects vibrational and rotational transitions. UV-visible spectroscopy uses higher energy light (shorter wavelengths) and provides information about the overall electronic structure, while IR spectroscopy uses lower energy light and gives details about specific chemical bonds and functional groups.
10. How does UV-visible spectroscopy help in studying reaction kinetics?
UV-visible spectroscopy can monitor reaction progress by measuring changes in absorption over time. If reactants and products have different absorption characteristics, the reaction rate can be determined by following the increase or decrease of specific absorption bands. This technique is particularly useful for reactions that occur on timescales of seconds to hours.
11. What are the limitations of UV-visible spectroscopy?
Limitations of UV-visible spectroscopy include: 1) It's not suitable for all compounds, particularly those without suitable chromophores. 2) It provides less structural information compared to techniques like NMR or IR. 3) Interferences from other absorbing species can complicate analysis. 4) It may have limited sensitivity for some applications. 5) It cannot distinguish between structural isomers with similar chromophores.
12. How can UV-visible spectroscopy be used to determine the concentration of a solution?
UV-visible spectroscopy can determine solution concentration using Beer-Lambert's law. By measuring the absorbance at a specific wavelength and knowing the molar extinction coefficient and path length, the concentration can be calculated. Alternatively, a calibration curve can be created using standard solutions of known concentrations to determine unknown concentrations.
13. What is the role of a blank or reference solution in UV-visible spectroscopy?
A blank or reference solution is used to account for background absorption and instrumental factors. It typically contains all components of the sample solution except the analyte. By subtracting the blank's absorbance from the sample's absorbance, the true absorbance of the analyte is obtained, eliminating effects from the solvent, cuvette, and instrument.
14. How does temperature affect UV-visible spectra?
Temperature can influence UV-visible spectra in several ways: 1) It can affect molecular vibrations, leading to slight peak broadening at higher temperatures. 2) It may cause shifts in chemical equilibria, altering the concentrations of absorbing species. 3) For some compounds, it can induce conformational changes that affect absorption characteristics. 4) In extreme cases, it might cause chemical changes that significantly alter the spectrum.
15. What types of molecules can be analyzed using UV-visible spectroscopy?
UV-visible spectroscopy is particularly useful for analyzing molecules with conjugated systems, such as organic compounds with alternating single and double bonds, aromatic compounds, and molecules containing chromophores (light-absorbing groups). It can also be used to study transition metal complexes and some biological molecules.
16. What is the difference between qualitative and quantitative analysis in UV-visible spectroscopy?
Qualitative analysis in UV-visible spectroscopy involves identifying compounds based on their characteristic absorption patterns, peak positions, and spectral shapes. Quantitative analysis, on the other hand, uses the relationship between absorbance and concentration (Beer-Lambert's law) to determine the amount of a substance present in a sample.
17. What is the significance of the molar extinction coefficient in UV-visible spectroscopy?
The molar extinction coefficient (ε) is a measure of how strongly a chemical species absorbs light at a given wavelength. It is a constant for a particular substance and is used in Beer-Lambert's law to relate absorbance to concentration. A higher molar extinction coefficient indicates stronger light absorption, making the compound easier to detect at lower concentrations.
18. How does UV-visible spectroscopy compare to fluorescence spectroscopy?
While both techniques involve electronic transitions, UV-visible spectroscopy measures light absorption, whereas fluorescence spectroscopy measures light emission after absorption. Fluorescence is generally more sensitive but applicable to fewer compounds. UV-visible spectroscopy is more widely applicable but may be less sensitive for some analyses.
19. What is the significance of the "shoulder" in a UV-visible spectrum?
A shoulder in a UV-visible spectrum appears as a bulge or broadening on the side of a major peak. It often indicates the presence of an additional electronic transition that is close in energy to the main transition but not fully resolved. Shoulders can provide valuable information about molecular structure, particularly in complex molecules with multiple chromophores.
20. How does solvent choice affect UV-visible spectra?
Solvent choice can significantly affect UV-visible spectra through solvent-solute interactions. Different solvents can cause shifts in absorption maxima (solvatochromism), changes in peak intensity, or alterations in spectral shape. These effects are due to changes in the electronic environment of the molecule and can provide information about molecular properties and interactions.
21. How does pH affect UV-visible spectra?
pH can significantly affect UV-visible spectra, especially for molecules with acidic or basic functional groups. Changes in pH can alter the protonation state of these groups, leading to shifts in absorption maxima, changes in peak intensity, or the appearance/disappearance of peaks. This effect is often used to study acid-base properties of molecules.
22. How does UV-visible spectroscopy help in determining molecular structure?
UV-visible spectroscopy provides information about electronic transitions, which are influenced by molecular structure. The position and intensity of absorption bands can indicate the presence of certain chromophores, conjugated systems, or metal complexes. While not as detailed as some other spectroscopic techniques, it can offer valuable structural insights, especially when combined with other analytical methods.
23. What is the significance of the "isobestic point" in UV-visible spectroscopy?
An isobestic point is a wavelength at which the total absorbance of a sample remains constant during a chemical reaction or a physical change. It indicates that the molar extinction coefficients of the reactant and product are the same at that wavelength. Isobestic points are useful for confirming the presence of only two interconverting species and for monitoring reaction progress.
24. How does UV-visible spectroscopy assist in studying metal complexes?
UV-visible spectroscopy is particularly useful for studying metal complexes because it can probe d-d transitions in transition metal ions and charge transfer bands. The position and intensity of these bands provide information about the metal's oxidation state, coordination geometry, and ligand field strength. This makes it a valuable tool in inorganic and coordination chemistry.
25. What is the principle behind derivative spectroscopy in UV-visible analysis?
Derivative spectroscopy involves taking the mathematical derivatives of absorption spectra. First, second, or higher-order derivatives can enhance spectral features, improving resolution and sensitivity. This technique can help separate overlapping peaks, minimize background interference, and enhance the ability to detect minor spectral features, making it useful for complex mixture analysis.
26. How does UV-visible spectroscopy contribute to the study of tautomerism?
UV-visible spectroscopy can provide insights into tautomerism:
27. How does circular dichroism (CD) spectroscopy relate to UV-visible spectroscopy?
Circular dichroism spectroscopy is closely related to UV-visible spectroscopy:
28. What is meant by the term "absorption maximum" in UV-visible spectroscopy?
The absorption maximum, often denoted as λmax, is the wavelength at which a molecule shows the highest absorption of light in its UV-visible spectrum. This peak corresponds to the most probable electronic transition and is characteristic of the molecule's structure, making it useful for identification and quantification.
29. What is meant by a "bathochromic shift" in UV-visible spectroscopy?
A bathochromic shift, also known as a red shift, is a shift of the absorption maximum to a longer wavelength (lower energy). This can occur due to changes in solvent polarity, pH, or structural modifications that extend the conjugation in a molecule, resulting in a smaller energy gap between ground and excited states.
30. What is meant by "hypochromic" and "hyperchromic" effects in UV-visible spectroscopy?
Hypochromic and hyperchromic effects refer to changes in absorption intensity. A hypochromic effect is a decrease in absorption intensity, while a hyperchromic effect is an increase. These effects can occur due to various factors such as changes in molecular conformation, aggregation, or interactions with other species, providing information about molecular behavior in solution.
31. How does UV-visible spectroscopy help in studying protein denaturation?
UV-visible spectroscopy can monitor protein denaturation by tracking changes in absorption. As proteins unfold, the environment of aromatic amino acids (tryptophan, tyrosine, phenylalanine) changes, affecting their absorption characteristics. Additionally, if the protein contains prosthetic groups or cofactors, their absorption may also change upon denaturation, providing insights into the protein's structural integrity.
32. What is meant by "forbidden" and "allowed" transitions in UV-visible spectroscopy?
In UV-visible spectroscopy, "allowed" transitions are those that comply with selection rules and have a high probability of occurring, resulting in strong absorption bands. "Forbidden" transitions violate these rules and are less likely to occur, resulting in weak or absent absorption bands. However, some "forbidden" transitions can still be observed due to mechanisms like vibronic coupling.
33. How does UV-visible spectroscopy contribute to the study of nanoparticles?
UV-visible spectroscopy is valuable in nanoparticle research, particularly for metal nanoparticles. It can be used to:
34. How does UV-visible spectroscopy aid in studying DNA and RNA?
UV-visible spectroscopy is crucial in nucleic acid research:
35. What is the concept of "auxochromes" in UV-visible spectroscopy?
Auxochromes are functional groups that, when attached to a chromophore, alter its light absorption characteristics. While not chromophores themselves, auxochromes can shift the absorption maximum and increase the intensity of absorption. Common auxochromes include -OH, -NH2, -NHR, and -NR2 groups. Understanding auxochromes helps predict and interpret spectra of complex organic molecules.
36. How does UV-visible spectroscopy contribute to the study of photochemical reactions?
UV-visible spectroscopy is invaluable in photochemistry:
37. What is the significance of the "cut-off wavelength" in UV-visible spectroscopy?
The cut-off wavelength is the shortest wavelength at which a solvent or a specific component of the instrument (like the cuvette material) begins to absorb significantly. Below this wavelength, the background absorption becomes too high for reliable measurements. Understanding the cut-off wavelength is crucial for selecting appropriate solvents and experimental conditions, especially when analyzing compounds that absorb at shorter wavelengths.
38. How does UV-visible spectroscopy assist in studying enzyme kinetics?
UV-visible spectroscopy is widely used in enzyme kinetics:
39. What is the principle behind dual-wavelength spectrophotometry?
Dual-wavelength spectrophotometry involves measuring absorbance at two different wavelengths simultaneously. This technique is useful when:
40. What is the concept of "spectral bandwidth" in UV-visible spectroscopy, and why is it important?
Spectral bandwidth refers to the range of wavelengths passing through the monochromator in a spectrophotometer. It's important because:
41. How does UV-visible spectroscopy contribute to the study of charge-transfer complexes?
UV-visible spectroscopy is a key tool for studying charge-transfer complexes:
42. What is the principle behind stopped-flow spectroscopy, and how does it relate to UV-visible measurements?
Stopped-flow spectroscopy is a technique used to study fast reaction kinetics:
43. What is the significance of the "Q-band" and "Soret band" in UV-visible spectra of porphyrins and related compounds?
In the UV-visible spectra of porphyrins and similar compounds:

Articles

Back to top