

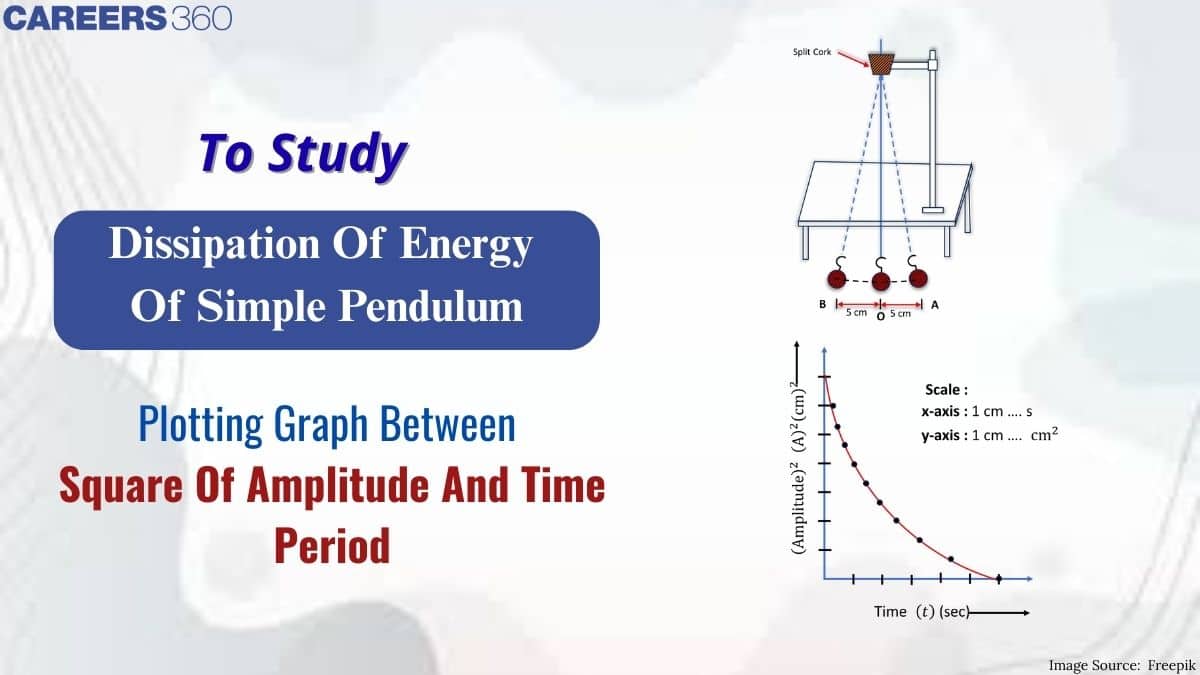
To Study Dissipation Of Energy Of Simple Pendulum By Plotting Graph Between Square Of Amplitude And Time Perio
The study dissipation of energy of a simple pendulum by plotting a graph between square of amplitude and time is an important experiment in Physics that explains how energy gradually decreases during oscillations. Due to air resistance and friction, the amplitude of a pendulum reduces with time, showing clear dissipation of energy in simple pendulum motion. Since the energy of a pendulum is proportional to the square of its amplitude, plotting a graph between square of amplitude and time helps to study this energy loss effectively. This concept is widely used in exams, making simple pendulum dissipation of energy by plotting a graph between square of amplitude and time an important topic for students.
In this topic, you will learn to study dissipation of energy of a simple pendulum, understand its theory, perform the experiment, and analyze the graph. These concepts are essential for solving numerical problems and conceptual questions related to simple pendulum dissipation of energy in competitive exams.
This Story also Contains
- Aim
- Apparatus
- Theory
- Procedure
- Observations
- Result
- Precautions
- Conclusion
- Solved Examples Based on Study Dissipation of Energy of Simple Pendulum By Plotting Graph Between Square Of Amplitude And Time Period
- Summary
Aim
To study the dissipation of energy of a simple pendulum by plotting a graph between the square of amplitude and time.
Apparatus
A pendulum bob, a split cork, thread, a metre scale, a clamp stand, a stopwatch, and a chalk piece.
Theory
$\begin{aligned} & \mathrm{F}=-\mathrm{kx} \\ & \mathrm{E}=\frac{1}{2} K a^2 \\ & \mathrm{~F}=\text { Force }, \mathrm{x}=\text { distance } \\ & \mathrm{E}=\text { Energy }, \mathrm{a}=\text { Amplitude and, } \\ & \qquad k=\frac{m g}{l}\end{aligned}$
Procedure
1. Determine the mass m of the bob with the help of physical balance.
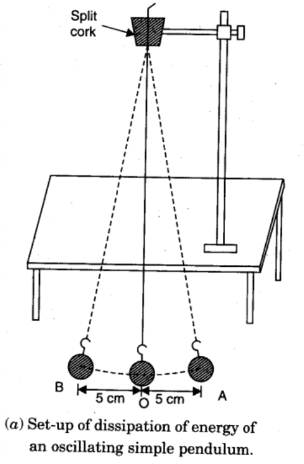
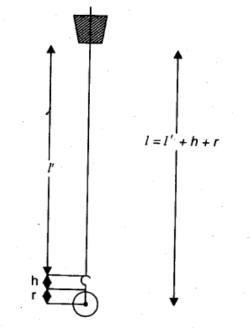
2. Take a cotton thread about 150 cm long, tie the bob to one end of the thread and pass the other end of the thread through the split cork so that the effective length of the pendulum is 130 cm, (effective length of the pendulum is equal to the radius of the bob + length of the hook of the bob-pendulum + length of the thread) as shown in the diagram. Tight the two half-cork pieces between the
clamp.
3. Now put the stand on the table in such a manner that the bob is about 1 to 2 cm above the ground.
4 Put a metre scale just below the bob so that a full-scale division lies below the centre of the bob. 5. Take the bob along the metre scale 5 cm away from the rest position (mean position) of the bob and release it. The bob starts vibrating about the mean position 0 and you will observe that its amplitude decreases as time passes.
5. Take the bob along the metre scale 5 cm away from the rest position (mean position) of the bob and release it. The bob starts vibrating about the mean position 0 and you will observe that its amplitude decreases as time passes.
6. Take the bob to its mean position 0 (stop position). Find out the least count of the stopwatch.
7. Again take the bob along the metre scale 5 cm away from the rest position 0 and release it so that it vibrates in the same vertical plane.
8. Watch the moment of the bob, when it comes to the extreme right position, start the stopwatch and also note the position of the bob on the metre scale and record this time as zero.
9. Keep your eye on the movement of the bob continuously observe the amplitude of the bob and record time simultaneously after every alternate oscillation, i.e., 0,2,4,6,8 oscillations till the amplitude decays to about 1 cm.
10. Take 10 observations.
11. Record all the observations in the table.
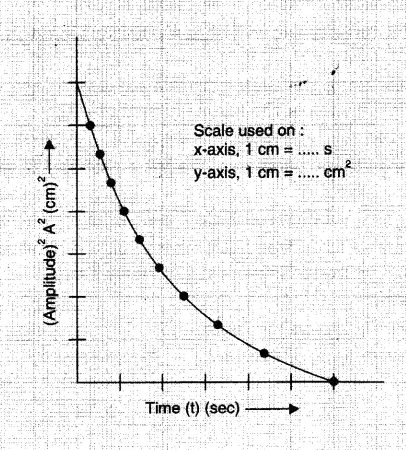
12. Plot a graph between amplitude square, i.e. $A_0^2$ and time ( $t$, taking along $X$-axis and $A_0^2$ along $Y$-axis.
Observations
Mass of the bob by physical balance $=\ldots \mathrm{g}=\ldots. \times 10^{-3} \mathrm{~kg}$.
Least count of the stopwatch $=\ldots... S$
The effective length of the pendulum $\mathrm{l}=\ldots \ldots \mathrm{cm}=\ldots \ldots \mathrm{m}$
Force constant
$
k=\frac{m g}{l}=\ldots \ldots \mathrm{Nm}^{-1}
$
(Take the value of $g=9.8 \mathrm{~ms}^{-2}$ )
Result
The graph plotted between the square of the amplitude and time is shown below. The graph shows the dissipation of energy of a simple pendulum with time.
Precautions
- Ensure the pendulum support is rigid and does not shake during oscillations.
- The amplitude should remain small (less than 10°) to maintain simple harmonic motion.
- Use a long pendulum (about 1–2 metres) for better accuracy in time measurements.
- The bob should be released gently without pushing to avoid giving extra energy.
- Ensure the thread is weightless, inextensible, and free from knots.
- Avoid air disturbances; keep windows and fans switched off during the experiment.
- Keep your eye perpendicular to the metre scale to avoid parallax error while reading amplitude.
- The pendulum should swing in one vertical plane only; avoid twisting of the thread.
- Start and stop the stopwatch accurately at the extreme position of the bob.
- Take multiple readings and average them to minimise observation errors.
Conclusion
We know that the energy E of a simple pendulum is directly proportional to the square of the amplitude $A^2\left(E=\frac{1}{2} k A_0^2\right)$, and we observed that amplitude decays with the passage of time and hence the energy of pendulum dissipates with time.
Precautions
1. Pendulum support should be rigid.
2. The amplitude should remain small.
3. The pendulum should be sufficiently long (about 2 metres).
4. Pulling string should be used to avoid spinning the metallic block.
Solved Examples Based on Study Dissipation of Energy of Simple Pendulum By Plotting Graph Between Square Of Amplitude And Time Period
Example 1: In the experiment of a simple pendulum, we have taken a thread of 140 cm , and an amplitude of 5 cm to begin with. Here $\theta$ to begin with is about
1) $5^{\circ}$
2) $8^{\circ}$
3) $3^{\circ}$
4) $2^0$
Solution
As we know, therefore, $\theta=\frac{l}{r}=\frac{5 \mathrm{~cm}}{140 \mathrm{~cm}}=\frac{1}{28} \quad \mathrm{rad}=2.05^{\circ} \cong 2^{\circ}$
Hence, the answer is the option (4).
Example 2: A physics experiment involves measuring the acceleration due to gravity using a simple pendulum. The length of the pendulum is 0.8 m, and the time period of one oscillation is 1.6 s. The experimental setup introduces an error in measuring the length of the pendulum as 0.02 m and an error in timing as 0.05 s. Determine the acceleration due to gravity.
1) 8.45214 m/s2
2) 5.42256 m/s2
3) 6.24662 m/s2
4) 10.35874 m/s2
Solution:
Given values:
Length of pendulum (L) = 0.8 m
Time period (T) = 1.6 s
Error in length measurement (EL) = 0.02 m
Error in time measurement (ET ) = 0.05 s
The acceleration due to gravity (g) can be calculated using the formula:
$
g=\frac{4 \pi^2 L}{T^2}
$
Step 1: Calculate the acceleration due to gravity without errors:
$
g_{\text {actual }}=\frac{4 \pi^2 * 0.8 \mathrm{~m}}{(1.6 \mathrm{~s})^2} \approx 9.8696 \mathrm{~m} / \mathrm{s}^2
$
Step 2: Calculate the maximum possible error in g due to errors in length and time measurements:
$
\Delta g=\left|\frac{\delta g}{\delta L}\right| E_L+\left|\frac{\delta g}{\delta T}\right| E_T
$
where,
$
\frac{\delta g}{\delta L}=\frac{4 \pi^2}{T^2} \quad \text { and } \quad \frac{\delta g}{\delta T}=-\frac{8 \pi^2 L}{T^3}
$
Substitute the values:
$
\Delta g=\left|\frac{4 \pi^2}{(1.6 s)^2}\right| * 0.02 m+\left|-\frac{8 \pi^2 * 0.8 m}{(1.6 s)^3}\right| * 0.05 s \approx 0.4891 \mathrm{~m} / \mathrm{s}^2
$
Step 3: Calculate the range of $g$ values:
$
\begin{aligned}
& g_{\min }=g_{\text {actual }}-\Delta g \approx 9.8696 \mathrm{~m} / \mathrm{s}^2-0.4891 \mathrm{~m} / \mathrm{s}^2 \approx 9.3805 \mathrm{~m} / \mathrm{s}^2 \\
& g_{\max }=g_{\text {actual }}+\Delta g \approx 9.8696 \mathrm{~m} / \mathrm{s}^2+0.4891 \mathrm{~m} / \mathrm{s}^2 \approx 10.3587 \mathrm{~m} / \mathrm{s}^2
\end{aligned}
$
The acceleration due to gravity is estimated to be in the range of $9.3805 \mathrm{~m} / \mathrm{s}^2$ to $10.3587 \mathrm{~m} / \mathrm{s}^2$ based on the experimental setup and measurement errors.
Hence, the answer is the option (4).
Example 3: An experiment is conducted to determine the acceleration due to gravity (g) using a simple pendulum. The length of the pendulum is $L=1.2 \mathrm{~m}$, and the time period of one oscillation is $T=2 \mathrm{~s}$. Calculate the acceleration due to gravity.
1) $2.415 \mathrm{~m} / \mathrm{s}^2$
2) $3.728 \mathrm{~m} / \mathrm{s}^2$
3) $4.521 \mathrm{~m} / \mathrm{s}^2$
4) $6.225 \mathrm{~m} / \mathrm{s}^2$
Solution:
Given values:
Length of pendulum $(L)=1.2 \mathrm{~m}$
Time period $(T)=2 s$
The acceleration due to gravity $(\mathrm{g})$ can be calculated using the formula for the time period of a simple pendulum:
$
T=2 \pi \sqrt{\frac{L}{g}}
$
Solve for $\mathrm{g}:$
$
g=\frac{4 \pi^2 L}{T^2}
$
Step 1: Substitute the given values and calculate the acceleration due to gravity $(\mathrm{g})$ :
$
g=\frac{4 \pi^2 \times 1.2 \mathrm{~m}}{(2 \mathrm{~s})^2}
$
Step 2: Calculate g:
$
\begin{aligned}
g & =\frac{14.913 \mathrm{~m}^2 / \mathrm{s}}{4 \mathrm{~s}^2} \\
g & \approx 3.728 \mathrm{~m} / \mathrm{s}^2
\end{aligned}
$
The acceleration due to gravity is approximately $3.728 \mathrm{~m} / \mathrm{s}^2$.
Conclusion: The acceleration due to gravity is calculated to be approximately $3.728 \mathrm{~m} / \mathrm{s}^2$.
Hence, the answer is the option (2).
Example 4: In the experiment, calculate the acceleration due to gravity, By using a simple pendulum, which has a period of 0.3 seconds and is measured from a time of 50 oscillations with a watch of one second resolution. When the length is 5 cm known to have 1 mm accuracy find accuracy in the 'g'
1) 15.33 %
2) 12.33 %
3) 13 %
4) 15.55 %
Solution:
$\begin{aligned} & T=2 \pi \sqrt{\frac{l}{g}} \\ & g=\frac{1}{4 \pi^2 l} \frac{T^2}{l} \Rightarrow \frac{\Delta g}{T}=\frac{2 \Delta T}{T}+\frac{\Delta l}{l} \\ & \frac{\Delta g}{g}=2 \times \frac{1}{50 \times 0.3}+\frac{1 \mathrm{~mm}}{5 \mathrm{~cm}} \\ & =0.1533 \\ & \frac{\Delta g}{g} \times 100=15.33 \%\end{aligned}$
Hence, the answer is the option (1).
Example 5: In a laboratory experiment, the speed of sound in air is measured using a resonance tube. The tube is partially filled with water, and a tuning fork of known frequency is used to produce a standing wave inside the tube. The first resonance occurs when the tube length is $L_1=25 \mathrm{~cm}$, and the second resonance occurs when the tube length is $L_2=75 \mathrm{~cm}$. The frequency of the tuning fork is $f=256 \mathrm{~Hz}$. The speed of sound v in the air is:
1) $320 \mathrm{~m} / \mathrm{s}$
2) $256 \mathrm{~m} / \mathrm{s}$
3) $340 \mathrm{~m} / \mathrm{s}$
4) $350 \mathrm{~m} / \mathrm{s}$
Solution:
The speed of sound in air can be calculated using the formula:
$
v=f \cdot \lambda
$
where $f$ is the frequency of the tuning fork and $\lambda$ is the wavelength of the sound wave.
For the first resonance, the tube length $L_1$ is one-fourth of the wavelength $(\lambda / 4)$ :
$
L_1=\frac{\lambda}{4} \Longrightarrow \lambda=4 \cdot L_1
$
Similarly, for the second resonance, the tube length $L_2$ is three-fourths of the wavelength:
$
L_2=\frac{3 \lambda}{4} \Longrightarrow \lambda=\frac{4}{3} \cdot L_2
$
Equating the two expressions for $\lambda$ :
$
4 \cdot L_1=\frac{4}{3} \cdot L_2
$
Solve for $L_1$ :
$
L_1=\frac{1}{3} \cdot L_2
$
Now, substitute the values:
$
L_1=\frac{1}{3} \cdot 75 \mathrm{~cm}=25 \mathrm{~cm}
$
The wavelength ???? can be calculated using $L_1$ :
$
\lambda=4 \cdot 25 \mathrm{~cm}=100 \mathrm{~cm}=1 \mathrm{~m}
$
Finally, calculate the speed of sound ???? :
$
v=f \cdot \lambda=256 \mathrm{~Hz} \cdot 1 \mathrm{~m}=256 \mathrm{~m} / \mathrm{s}
$
The calculated speed of sound is approximately $256 \mathrm{~m} / \mathrm{s}$
Hence, the answer is the option (2).
Summary
In these experiments, we will look at how the energy of a simple pendulum shifts with time through the graphs of its amplitude square against that of its period. The relationship between how long one swing takes in relation to how much the pendulum swings can be understood by studying graphs obtained from this experiment. By and large, when any force that leads to loss in energy like friction or air resistance acts upon it, its amplitude decreases which results in changes in the duration for the completion of each swing.
Frequently Asked Questions (FAQs)
Because of energy loss due to air resistance and friction at the support, the pendulum gradually loses energy, causing its amplitude to decrease.
Energy of a pendulum is proportional to amplitude². Plotting amplitude² vs. time clearly shows how energy dissipates during motion.
Small amplitudes ensure the motion follows simple harmonic motion (SHM), making calculations accurate and theory applicable.
The support must be rigid, the pendulum long enough, amplitude small, and pulling string used to avoid twisting.
It indicates continuous energy dissipation in the pendulum due to damping forces like air resistance.
