

Distance Time Graph and Velocity Time Graph - Definition, Examples, FAQs
More importantly, for physicists, distance-time and velocity-time graphs are useful illustrations in describing as well as representing visual motion behaviours, through a change of position or speed with time, so that they understand the pattern of movement and have some idea about the future position.
In this article, we will discuss the distance-time graph for uniform motion and the velocity-time graph for uniform motion, covering the uses of these motion graphs, how they represent uniform and non-uniform motion, and the concept of the graphical representation of motion for Class 9 students.
What Is a Distance-Time Graph?
A distance-time graph shows how the distance travelled by an object changes with time. It is a simple graphical representation used to study motion.
In graph:
- Distance is plotted on the Y-axis
- Time is plotted on the X-axis
It helps us understand whether an object is moving at a constant speed or changing its speed.
Note: A curved line on a distance-time graph indicates that the speed is changing.
Importance of Distance-Time Graph
A distance-time graph is very useful in the study of motion. When we record the distance travelled at different times and plot it on a graph, we get a clear picture of how an object is moving.
It helps us to:
- Understand the nature of motion (uniform or non-uniform)
- Calculate speed from the slope of the graph
- Compare motion of different objects
Types of Distance-Time Graphs
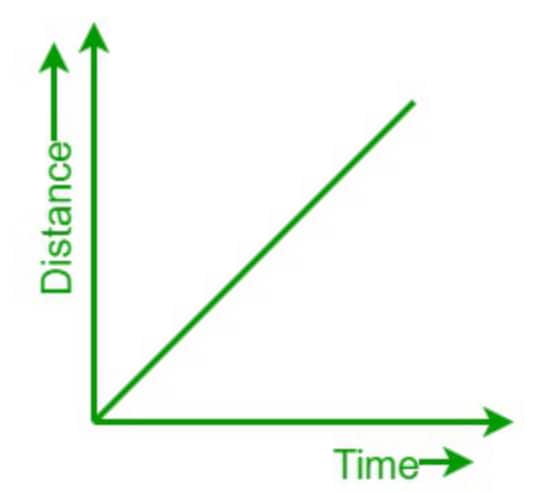
1. Uniform Motion (Straight Line)
When an object covers equal distances in equal intervals of time, the graph is a straight line.
This indicates constant speed.
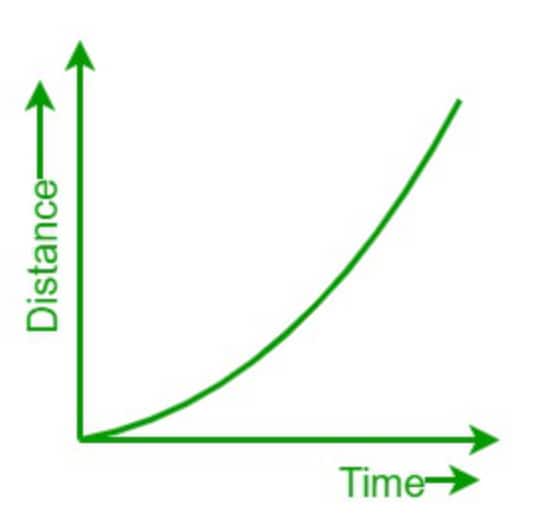
2. Non-Uniform Motion (Curved Line)
When an object covers unequal distances in equal intervals of time, the graph is a curve.
This indicates changing speed.
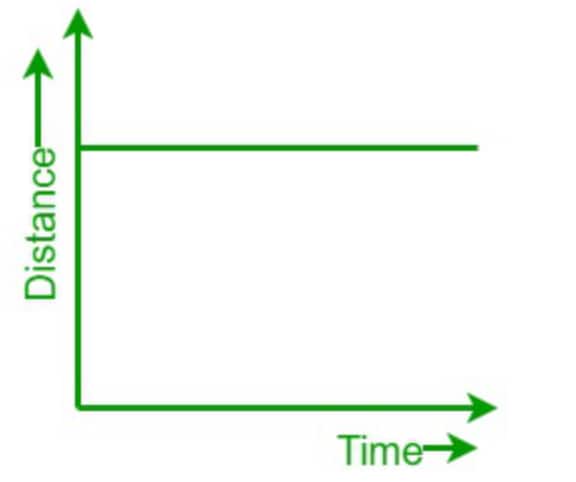
Distance-Time Graph for a Body at Rest:
In the distance-time graph for the body at rest, the graph will show a line parallel to the x-axis. The parallel line shows that the time is changing, but the position of the body is the same.
Let us now draw a distance-time graph for an object at rest.
Slope of Distance-Time Graph
The slope of a distance-time graph gives the speed of the object.
$
\text { Speed }=\frac{\text { Distance }}{\text { Time }}
$
What is a Velocity–Time Graph?
A velocity–time graph shows how the velocity of an object changes with time. In this graph, velocity is plotted on the Y-axis and time is plotted on the X-axis.
Case 1: Constant Velocity (Zero Acceleration)
When velocity remains constant, acceleration is zero. The graph is a straight horizontal line parallel to the time axis.
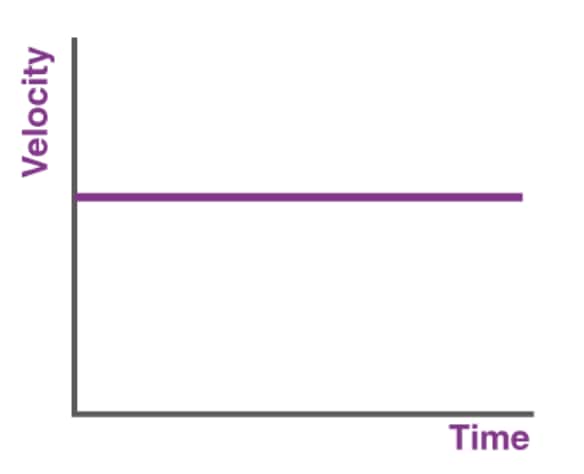
This indicates that the velocity does not change with time.
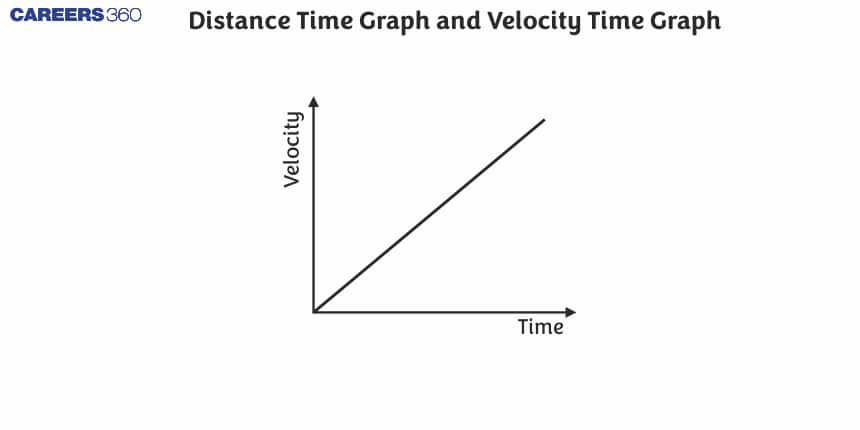
Case 2: Constant Acceleration
When acceleration is constant, velocity changes uniformly with time.
$v=u+a t$
If $u=0$, then
$v=a t$
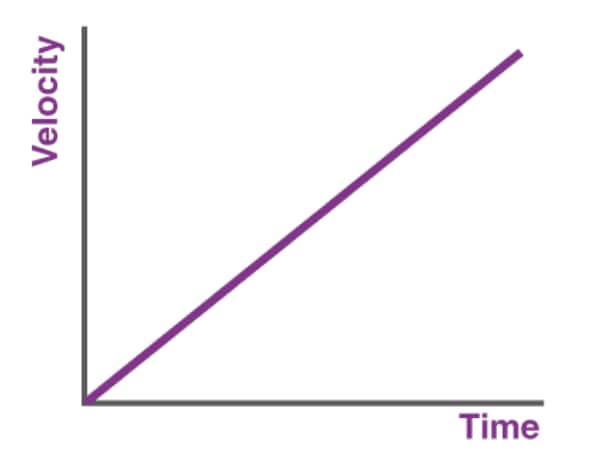
The graph is a straight line inclined to the time axis.
The slope of the graph gives the value of acceleration.
Case 3: Variable Acceleration
When acceleration changes with time, the velocity-time graph becomes a curve.
If acceleration increases, the graph becomes steeper with time.
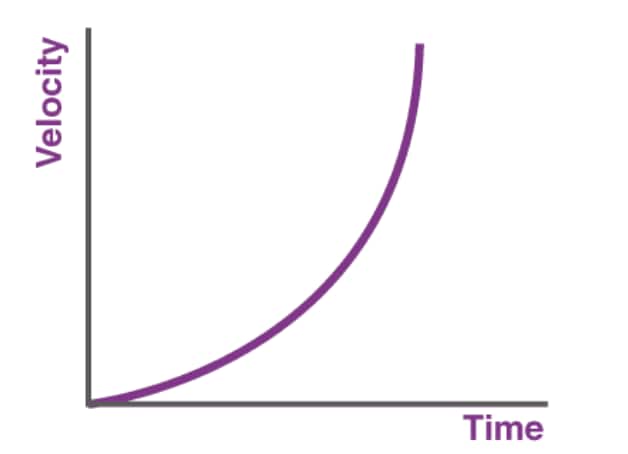
If acceleration decreases, the graph becomes less steep.
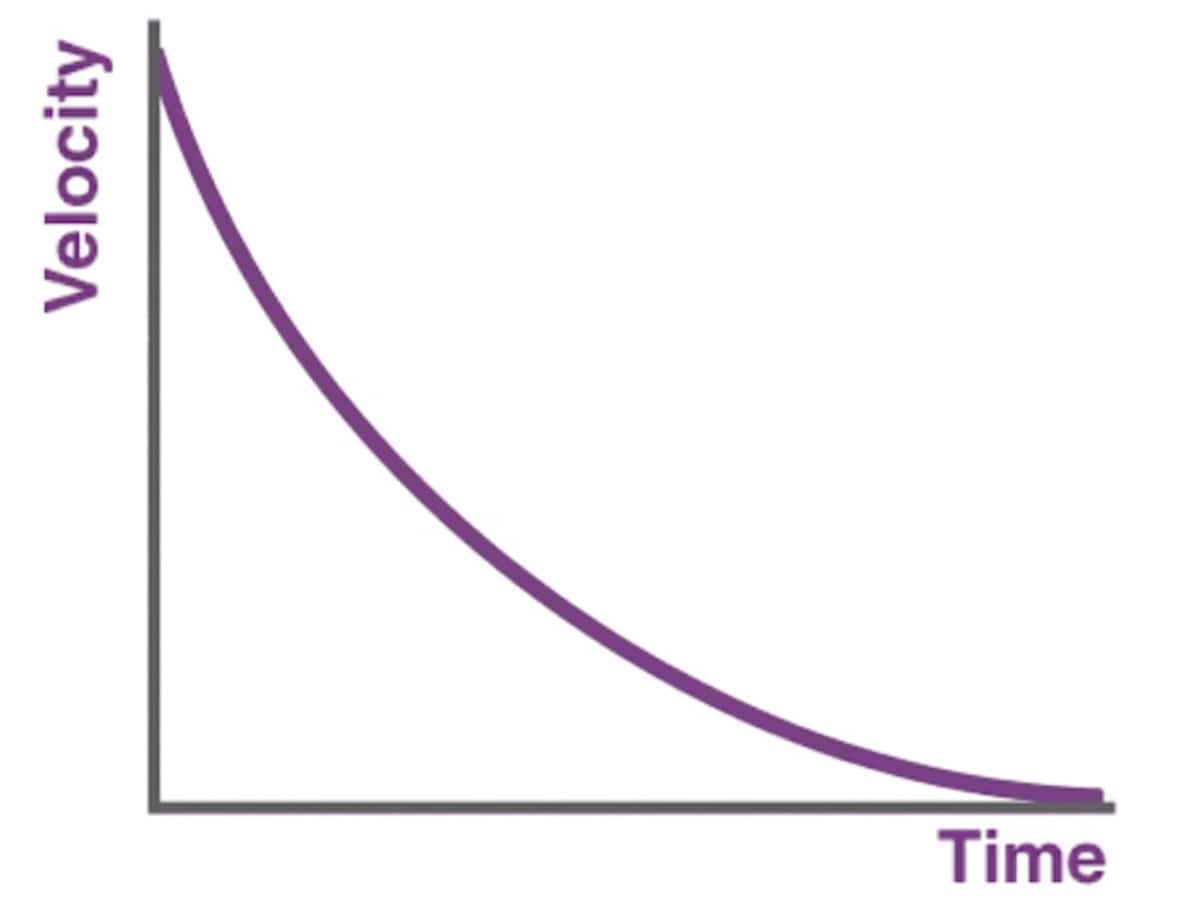
The slope at any point gives the acceleration at that instant.
Area Under Velocity-Time Graph
The area under the velocity-time graph represents the displacement of the object.
Difference Between Velocity-Time Graph and Speed-Time Graph
| Velocity-Time Graph | Speed-Time Graph |
| Shows how velocity changes with time | Shows how speed changes with time |
| Velocity is a vector quantity (has direction) | Speed is a scalar quantity (no direction) |
| Can have positive and negative values | Always positive |
| Graph can lie above or below time axis | Graph always lies above time axis |
| Slope gives acceleration (with direction) | Slope gives rate of change of speed |
| Area under graph gives displacement | Area under graph gives distance |
| Gives complete information about motion | Gives only magnitude of motion |
Frequently Asked Questions (FAQs)
Physical significance of distance time graph- The graph of distance and time is used to determine the position of an object at any time in the given time interval.
Physical significance of velocity time graph - To determine the magnitude of the displacement (distance).
The gradient of distance-time is equal to the velocity of an object.
The gradient of a velocity-time graph gives the acceleration of an object.
Negative gradient means that the slope of the graph is downwards.
The area enclosed by the velocity-time graph gives the magnitude of displacement.
Uniform decreasing accelerated motion means that there is a body which is having uniformly decreasing velocity.
The area under the curve of the time-distance graph represents no specific quantity.
A velocity-time (VT) graph is a graph that compares how velocity is varying with respect to time. This graph also provides the information of displacement and acceleration of the object.
A distance-time (DT) graph is a graph that basically compares how distance is varying with respect to time. This graph also provides the information of speed.
An object having negative acceleration, also known as deceleration, means that the object is moving in a positive direction and reducing velocity (slowing down) or moving in a negative direction and increasing velocity (speeding up).
Zero acceleration means velocity is not changing with time.