Graphical Representation of Quadratic Equation

Graphical Representation of Quadratic Equation

Edited By Komal Miglani | Updated on Jul 02, 2025 08:00 PM IST

A quadratic graph depicts a U-shaped curve drawn for a quadratic function. In Mathematics, a parabola is one of the conic sections, which is formed by the intersection of a right circular cone by a plane surface. It is a symmetrical plane U-shaped curve. A parabola graph whose equation is in the form of $f(x)=a x^2+b x+c$ is the standard form of a parabola. The vertex of a parabola is the extreme point in it whereas the vertical line passing through the vertex is the axis of symmetry.

This Story also Contains
  1. What is a Parabola Graph?
  2. Standard Form of Parabola Equation
  3. Vertex Form of Parabola Equation
  4. Solved Examples Based on Graph of Quadratic Equations
Graphical Representation of Quadratic Equation

In this article, we will cover the concept of the graph of quadratic equations. This concept falls under the broader category of complex numbers and quadratic equations, a crucial Chapter in class 11 Mathematics. It is not only essential for board exams but also for competitive exams like the Joint Entrance Examination (JEE Main), and other entrance exams such as SRMJEE, BITSAT, WBJEE, BCECE, and more.

What is a Parabola Graph?

A parabola is a U-shaped curve that is drawn for a quadratic function, $\mathrm{f}(\mathrm{x})=a x^2+b x+c$. The graph of the parabola is downward (or opens down) when the value of $a$ is less than $0, a<0$. The graph of parabola is upward (or opens up) when the value of

$a$ is more than $0, a>0$. Hence, the direction of a parabola is determined by the sign of coefficient ' $a$ '.

Vertex

The vertex of parabola will represent the maximum and minimum point of parabola.

Axis of Symmetry

The axis of symmetry of parabola always passes through its vertex and is parallel to y-axis.

y-intercept

The point at which the parabola graph passes through the y-axis is called y-intercept. The parabola of quadratic function passes through an only a single point at the y-axis,

x-intercepts

The points at which the parabola graph passes through the x-axis, are called x-intercepts, which expresses the roots of quadratic function.

Standard Form of Parabola Equation

The equation of parabola can be expressed in two different ways, such as the standard form and the vertex form. The standard form of parabola equation is expressed as follows:

$
f(x)=y=a x^2+b x+c
$

The orientation of the parabola graph is determined using the "a" value.
If the value of $a$ is greater than $0(a>0)$, then the parabola graph is oriented towards the upward direction.
If the value of $a$ is less than $0(a<0)$, then the parabola graph opens downwards.
The axis of symmetry from the standard form of the parabola equation is given as:

$
x=\frac{-b}{2 a}
$

Vertex Form of Parabola Equation

The extreme point of a parabola, whether it is maximum or minimum, is called the vertex of the parabola. The parabola equation can also be represented using the vertex form.

Vertex Form of a Parabola:

$
f(x)=y=a(x-h)^2+k
$

Here, $(h, k)$ is the vertex of the parabola.

Similar to the standard form of the parabola equation, the orientation of the parabola in the vertex form is determined by the parameter " $a$ ".
- If the value of $a$ is positive $(a>0)$, the parabola opens upward.
- If the value of $a$ is negative $(a<0)$, the parabola opens downward.

How to graph a quadratic function ?

We have $y=f(x)=a x^2+b x+c$ where $a, b, c \in R$ and $a \neq d$
Expression $y=a x^2+b x+c=f(x)$ can be represented as

$
y=a\left(x^2+\frac{b}{a} x+\frac{c}{a}\right)
$

which on further simplification is converted in the form of

$
\begin{aligned}
& \Rightarrow y=a\left[\left(x+\frac{b}{2 a}\right)^2-\frac{D}{4 a^2}\right] \\
& \text { or }\left(y+\frac{D}{4 a}\right)=a\left(x+\frac{b}{2 a}\right)^2
\end{aligned}
$

Now, let $y+\frac{D}{4 a}=Y$ and $x+\frac{b}{2 a}=X$

$
\therefore \mathrm{Y}=\mathrm{aX}^2
$

The shape of the $y=f(x)$ will be parabolic
Vertex of the parabola will be $\left(\frac{-\mathrm{b}}{2 \mathrm{a}}, \frac{-\mathrm{D}}{4 \mathrm{a}}\right)$

$
\left[y+\frac{D}{4 a}=0 \Rightarrow y=-\frac{D}{4 a}\right]
$

If the parabola opens upward (when a > 0) then the y value of the vertex represents the least value of the equation, and if opens downward (when a < 0) then the y value of the vertex represents the greatest value of the parabola.

Both least and greatest values are attained at the x value of the vertex of the parabola

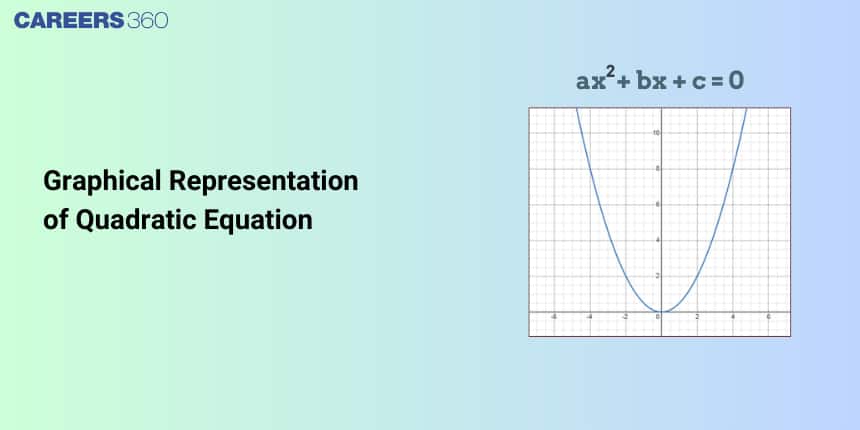
Hence the graph of any general quadratic equation will look like the below graph (given a>0)

Graph of a general quadratic equation

In the general quadratic equation if $y=a x^2+b x+c=f(x)$ and if $a>0$
Then the parabola opens upward. As given below,

Upward Parabola

if a < 0 it opens downward. As given below,

Downward Parabola

Important points on Graphing Quadratic Functions

  • The graph of the quadratic function is in the form of a parabola.
  • The coefficient a in $f(x)=a(x-h)^2+k$ determines whether the graph of a quadratic function will open upwards or downwards.
  • Graphing Quadratic Functions can be done using both general form and vertex form.

Recommended Video Based on Graph of Quadratic Equations


Solved Examples Based on Graph of Quadratic Equations

Example 1: $f(x)=2 x^2+a x+2$ if $f(x)=0$ has no real root then ' $a^{\prime}$ takes value lying in an interval
1) $(-5,5)$
2) $(-4,4)$
3) $(-6,6)$
4) $(-7,7)$

Solution:
As we learned in
Quadratic Expression Graph when $\mathrm{a}>0 \& \mathrm{D}<0$ -
No Real and Equal root of

$
\begin{aligned}
& f(x)=a x^2+b x+c \\
& \& D=b^2-4 a c \\
& \text { - wherein }
\end{aligned}
$

$\because f(x)=0$ has no real root, so $D<0$

$
\therefore a^2-16<0 \Rightarrow a \epsilon(-4,4)
$

$\therefore$ Option B
Example 2: If equations $a x^2+b x+c=0,(a, b, c \in R, a \neq 0)$ and $2 x^2+3 x+4=0$ Have a common root, then a:b:c equals :
1) $1: 2: 3$
2) $2: 3: 4$
3) $4: 3: 2$
4) $3: 2: 1$

Solution:
As we have learned
Quadratic Expression Graph when a $>0$ \& $<0$ -
No Real and Equal root of

$
\begin{aligned}
& f(x)=a x^2+b x+c \\
& \& D=b^2-4 a c
\end{aligned}
$

- wherein

Condition for both roots common -

$
\begin{aligned}
& \frac{a}{a^{\prime}}=\frac{b}{b^{\prime}}=\frac{c}{c^{\prime}} \\
& \text { - wherein } \\
& a x^2+b x+c=0_{\&} \\
& a^{\prime} x^2+b^{\prime} x+c^{\prime}=0
\end{aligned}
$

are the 2 equations

$
2 x^2+3 x+4=0 \text { has determinant }=9-32=-23<0
$

So, non-real roots which means both roots are common (as complex roots occur in conjugate )
So, a:b:c $=2: 3: 4 $

Example 3: The value of $\lambda$ such that the sum of the squares of the roots of the quadratic equation, $ x^{2} $
Solution:
Sum of Roots in Quadratic Equation -

$
\begin{aligned}
& a x^2+b x+c=0 \\
& a, b, c \in C
\end{aligned}
$


Product of Roots in Quadratic Equation -

$
\alpha \beta=\frac{c}{a}
$

- wherein
$\alpha$ and $\beta$ are roots of a quadratic equation:

$
\begin{aligned}
& a x^2+b x+c=0 \\
& a, b, c \in C
\end{aligned}
$

Quadratic Expression Graph when $a>0 \& \mathrm{D}<0$ -
No Real and Equal root of

$
\begin{aligned}
& f(x)=a x^2+b x+c \\
& \& D=b^2-4 a d \\
& \text { - wherein }
\end{aligned}
$

Given quadratic equation

$
x^2+(3-\lambda) x+2=\lambda
$

roots are $\alpha$ and $\beta$
from the concept

$
\begin{aligned}
\alpha+\beta & =\lambda-3 \text { and } \alpha \beta=2-\lambda \\
\alpha^2+\beta^2 & =(\alpha+\beta)^2-2 \alpha \beta \\
& =\lambda^2+9-6 \lambda-4+2 \lambda \\
& =\lambda^2-4 \lambda+5 \\
& =(\lambda-2)^2+1
\end{aligned}
$

least value when $\lambda=2$
Hence, the answer is 2 .
Example 4: Let $f(x)=x^2+2(a-1) x+(a+5)$, then the values of ' $a^{\prime}$ for which $f(x)=0$ doesn't have two real and distinct roots is
1) $(-1,4]$
2) $(-1,4)$
3) $(-1,4)$
4) $[-1,4]$

Solution:

Solution:
As we learned in
Quadratic Expression Graph when $\mathrm{a}>0$ \& $\mathrm{D}=0$ -
Real and Equal roots of

$
f(x)=a x^2+b x+c
$

\& $D=b^2-4 a c$
- wherein

$\because f(x)=0$ doesn't have real and distinct roots, so either it will have real and equal roots or imaginary roots.

$
\begin{aligned}
& \text { So } D \leq 0 \Rightarrow 4\left(a^2-2 a+1\right)-4(a+5) \leq 0 \\
& \Rightarrow(a-4)(a+1) \leq 0 \Rightarrow a \epsilon[-1,4]
\end{aligned}
$


Example 5: Let $f(x)=x^2+2(a-1) x+\left(a^2+1\right)$ then the values of ' $a$ ' for which $f(x)=0$ has real and equal roots is
Solution:
As we learned in
Quadratic Expression Graph when $a>0 \& D=0$ -
Real and Equal roots of

$
\begin{aligned}
& f(x)=a x^2+b x+c \\
& \& D=b^2-4 a c
\end{aligned}
$

- wherein

For $x^2+2(a-1) x+\left(a^2+1\right)=0$, to have real and equal roots, $D=0$

$
\begin{aligned}
& \Rightarrow 4\left(a^2-2 a+1\right)-4\left(a^2+1\right)=0 \\
& \Rightarrow a=0
\end{aligned}
$

Frequently Asked Questions (FAQs)

1. What is a quadratic equation?

A polynomial that has degree two is called a quadratic equation.

2. Give the formula for the discriminant of the quadratic equation.

The discriminant of the quadratic equation is given by $\mathrm{D}=\mathrm{b}^2-4 \mathrm{ac}$.

3. Write different ways to express the parabola equation.

Standard and vertex forms are two ways to express parabola equations.

4. What is the standard form of the parabola equation?

The standard form of the parabola equation is $y=a x^2+b x+c$.

5. What is a quadratic equation and how is it represented graphically?
A quadratic equation is a polynomial equation of degree 2, typically in the form ax² + bx + c = 0, where a ≠ 0. Graphically, it is represented by a curve called a parabola. The parabola can open upward (if a > 0) or downward (if a < 0) and may or may not intersect the x-axis, depending on the number of real roots.
6. How does the value of 'a' in a quadratic equation affect its graph?
The coefficient 'a' determines the direction and steepness of the parabola. If a > 0, the parabola opens upward; if a < 0, it opens downward. The larger the absolute value of 'a', the steeper and narrower the parabola becomes.
7. What is the vertex of a parabola and how is it significant?
The vertex is the highest or lowest point of a parabola. For an upward-opening parabola, it's the lowest point; for a downward-opening parabola, it's the highest point. The vertex represents the maximum or minimum value of the quadratic function and is crucial for understanding the function's behavior.
8. How can you determine if a quadratic equation has real roots from its graph?
A quadratic equation has real roots if its graph intersects the x-axis. If the parabola crosses the x-axis at two points, it has two distinct real roots. If it touches the x-axis at one point, it has one repeated real root. If it doesn't touch or cross the x-axis, it has no real roots.
9. What is the axis of symmetry in a parabola?
The axis of symmetry is a vertical line that passes through the vertex of the parabola, dividing it into two mirror-image halves. It's represented by the equation x = -b/(2a), where 'a' and 'b' are coefficients from the quadratic equation ax² + bx + c = 0.
10. How does the y-intercept of a quadratic function relate to its equation?
The y-intercept is the point where the parabola crosses the y-axis. In the standard form of a quadratic equation (ax² + bx + c = 0), the y-intercept is equal to the constant term 'c'. It represents the value of y when x = 0.
11. What information can you derive from the discriminant of a quadratic equation?
The discriminant, given by b² - 4ac, provides information about the nature of the roots:
12. How can you sketch a parabola given its equation?
To sketch a parabola:
13. How does translating a parabola affect its equation?
Translating a parabola changes its position but not its shape. A horizontal shift of h units changes x to (x - h), while a vertical shift of k units adds k to the entire equation. For example, y = ax² becomes y = a(x - h)² + k when shifted h units right and k units up.
14. What is the significance of the x-intercepts in a quadratic graph?
The x-intercepts, if they exist, represent the solutions or roots of the quadratic equation. They are the points where the parabola crosses the x-axis, and their x-coordinates are the values of x that make y = 0 in the quadratic equation.
15. How can you determine the range of a quadratic function from its graph?
The range of a quadratic function depends on its direction and vertex. For an upward-opening parabola (a > 0), the range is [y ≥ k], where k is the y-coordinate of the vertex. For a downward-opening parabola (a < 0), the range is [y ≤ k].
16. How can you use the graph of a quadratic function to solve related equations?
The graph can be used to solve equations like ax² + bx + c = k by finding where the parabola y = ax² + bx + c intersects the horizontal line y = k. The x-coordinates of these intersection points are the solutions to the equation.
17. How does factoring a quadratic equation relate to its graphical representation?
Factoring a quadratic equation ax² + bx + c into the form a(x - r₁)(x - r₂) reveals its roots. Graphically, r₁ and r₂ are the x-coordinates of the points where the parabola intersects the x-axis. If the equation can't be factored over real numbers, the parabola doesn't cross the x-axis.
18. What is the geometric interpretation of completing the square for a quadratic equation?
Completing the square transforms the quadratic equation into vertex form: a(x - h)² + k. Geometrically, this reveals the vertex (h, k) of the parabola and shows how the graph is translated from the basic form y = ax².
19. How can you use symmetry to sketch a more accurate parabola?
The axis of symmetry divides the parabola into two mirror-image halves. Once you've identified the axis of symmetry and plotted the vertex, you can plot points on one side of the parabola and reflect them across the axis to get corresponding points on the other side, ensuring a symmetrical and accurate sketch.
20. How does the graph of a quadratic function change when you add a linear term (bx)?
Adding a linear term bx to ax² shifts the parabola horizontally and vertically. It moves the vertex away from the y-axis and changes the axis of symmetry. The parabola is no longer symmetric about the y-axis unless b = 0.
21. How can you use transformations to graph a quadratic function quickly?
To graph y = a(x - h)² + k quickly:
22. What is the relationship between the graph of y = ax² and y = ax²/n, where n is a positive constant?
The graph of y = ax²/n is a vertical stretch of y = ax² by a factor of 1/n. If n > 1, the parabola becomes narrower (stretched vertically). If 0 < n < 1, the parabola becomes wider (compressed vertically). The vertex remains at (0,0), but the rate of change is affected.
23. How does the graph of a quadratic function relate to its inverse, if it exists?
A quadratic function is not one-to-one, so it doesn't have an inverse in its entirety. However, if we restrict the domain to x ≥ h or x ≤ h (where h is the x-coordinate of the vertex), we can define an inverse. The graph of this inverse is a reflection of the original restricted parabola over the line y = x.
24. What is the geometric interpretation of the discriminant being equal to zero?
When the discriminant (b² - 4ac) equals zero, the parabola touches the x-axis at exactly one point. Geometrically, this means the parabola is tangent to the x-axis. The point of tangency represents a repeated root of the quadratic equation.
25. How can you use the graph of a quadratic function to estimate its roots?
To estimate roots from a graph:
26. What is the relationship between the area enclosed by a parabola and the x-axis, and the roots of the quadratic equation?
The area enclosed between a parabola and the x-axis (if the parabola intersects the x-axis) is related to the roots of the quadratic equation. The roots determine the interval on the x-axis, and the shape of the parabola determines the area above or below this interval. This concept is crucial in integral calculus.
27. How does the graph of a quadratic function change when you compose it with an absolute value function?
When you compose a quadratic function with an absolute value function, i.e., y = |ax² + bx + c|, the portion of the parabola below the x-axis is reflected above the x-axis. This creates a "V" shape at any x-intercept, and eliminates any negative y-values in the range of the function.
28. How can you use the graph of a quadratic function to solve a system of equations involving a quadratic and a linear equation?
To solve a system with a quadratic and a linear equation graphically:
29. How does scaling affect the graph of a quadratic function?
Scaling a quadratic function affects its graph as follows:
30. What is the relationship between the roots of a quadratic equation and its graph?
The roots of a quadratic equation are the x-coordinates of the points where the parabola intersects the x-axis. If the equation has two distinct real roots, the graph will cross the x-axis at two points. If it has one repeated root, the graph will touch the x-axis at one point. If there are no real roots, the graph won't intersect the x-axis.
31. What is the difference between the graph of y = ax² and y = ax² + c?
The graph of y = ax² passes through the origin (0,0), while y = ax² + c is vertically shifted by 'c' units. If c > 0, the graph shifts up; if c < 0, it shifts down. The shape and orientation of the parabola remain the same.
32. How does the graph of a quadratic function change when you multiply the entire function by a negative number?
Multiplying a quadratic function by a negative number reflects the parabola over the x-axis. An upward-opening parabola becomes downward-opening, and vice versa. The x-intercepts remain the same, but the y-intercept and vertex change sign.
33. What is the relationship between the graph of y = ax² and y = a(x - p)² + q?
The graph of y = a(x - p)² + q is a translation of y = ax². It's shifted p units horizontally and q units vertically. The vertex of this parabola is at (p, q), whereas the vertex of y = ax² is at (0, 0).
34. What does it mean geometrically when a quadratic equation has no real roots?
Geometrically, when a quadratic equation has no real roots, its graph (a parabola) does not intersect or touch the x-axis at any point. For an upward-opening parabola, this means the entire graph lies above the x-axis; for a downward-opening parabola, it lies entirely below the x-axis.
35. How can you determine the number of solutions to a quadratic equation by looking at its graph?
The number of solutions is equal to the number of times the parabola intersects the x-axis:
36. What is the relationship between the coefficients of a quadratic equation and the shape of its graph?
The coefficient 'a' determines the direction and steepness of the parabola. The coefficients 'b' and 'c' affect the position of the parabola relative to the origin. Together, they influence the location of the vertex, the y-intercept, and whether the parabola intersects the x-axis.
37. What does the leading coefficient 'a' tell us about the concavity of a parabola?
The leading coefficient 'a' determines the concavity of the parabola:
38. What is the significance of the constant term 'c' in the graph of a quadratic function?
The constant term 'c' in a quadratic function y = ax² + bx + c represents the y-intercept of the parabola. It's the point where the parabola crosses the y-axis. Changing 'c' shifts the entire parabola up or down without affecting its shape or x-axis intersections.
39. What is the geometric significance of the focus and directrix of a parabola?
The focus is a fixed point and the directrix is a fixed line that together define a parabola. Every point on the parabola is equidistant from the focus and the directrix. The axis of symmetry passes through the focus and is perpendicular to the directrix. These elements are crucial in understanding parabolic reflectors and antenna designs.
40. What is the relationship between the graph of y = ax² and y = a(x - p)(x - q)?
The graph of y = a(x - p)(x - q) is a transformation of y = ax². The factors (x - p) and (x - q) reveal the roots of the equation: p and q. The parabola intersects the x-axis at these points. The vertex is at the midpoint between p and q on the x-axis. The direction of opening is still determined by the sign of 'a'.
41. What is the geometric interpretation of the average of the roots of a quadratic equation?
The average of the roots of a quadratic equation ax² + bx + c = 0 is given by -b/(2a). Geometrically, this represents the x-coordinate of the axis of symmetry of the parabola. It's the midpoint between the two x-intercepts (if they exist) and the x-coordinate of the vertex.
42. How can you use the graph of a quadratic function to understand its behavior as x approaches infinity or negative infinity?
As x approaches positive or negative infinity:
43. What is the relationship between the graphs of y = ax² + bx + c and y = -ax² - bx - c?
The graph of y = -ax² - bx - c is a reflection of y = ax² + bx + c over the x-axis. This means:
44. How does the graph of a quadratic function help in understanding its rate of change?
The graph of a quadratic function illustrates its rate of change

Articles

Back to top