

Energy Level Diagram
Energy level diagrams are graphical representations showing the relative energies of atomic or molecular orbitals. An energy level diagram would portray energy levels normally in the form of horizontal lines, such that the higher the position of the energy level, the more it is in energy. It is interpreted that these levels are occupied by electrons governed by the rules of quantum mechanics, in particular, the Aufbau principle, Pauli's exclusion principle, and Hund's rule.
This Story also Contains
- Molecular Orbital Energy Diagrams
- Also Read:
- Some Solved Examples
- Practice More Questions From the Link Given Below:
- Summary
In this article, we will cover the concept of Energy Level Diagram. This concept falls under the broader category of Chemical Bonding, which is a crucial chapter in Class 11 chemistry. It is not only essential for board exams but also for competitive exams like the Joint Entrance Examination (JEE Main), National Eligibility Entrance Test (NEET), and other entrance exams such as SRMJEE, BITSAT, WBJEE, BCECE, and more.
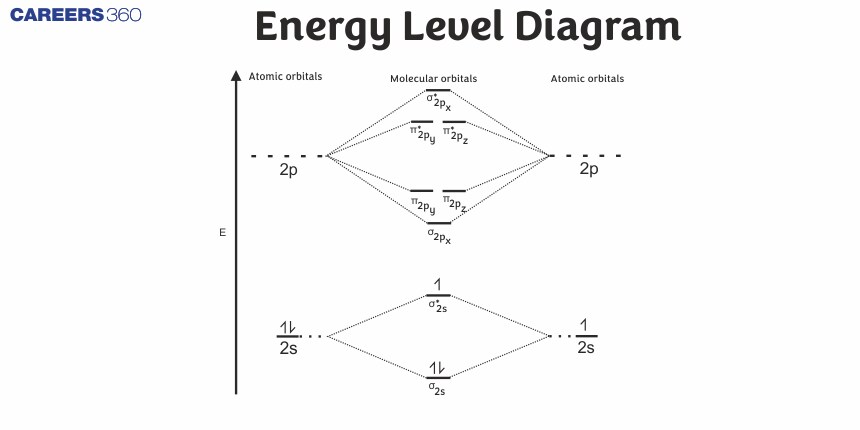
Molecular Orbital Energy Diagrams
The relative energy levels of atomic and molecular orbitals are typically shown in a molecular orbital diagram. As given in the figure below, for a diatomic molecule, the atomic orbitals of one atom are shown on the left, and those of the other atom are shown on the right. Each horizontal line represents one orbital that can hold two electrons. The molecular orbitals formed by the combination of the atomic orbitals are shown in the center. Dashed lines show which of the atomic orbitals combine to form the molecular orbitals. For each pair of atomic orbitals that combine, one lower-energy (bonding) molecular orbital and one higher-energy (antibonding) orbital result. Thus we can see that combining the six 2p atomic orbitals results in three bonding orbitals (one σ and two π) and three antibonding orbitals (one σ* and two π*).

Molecular Orbital Diagram
The molecular orbitals are filled in the same manner as atomic orbitals, using the Aufbau principle and Hund’s rule.
Also Read -
- NCERT Solutions for Class 11 Chemistry
- NCERT Solutions for Class 12 Chemistry
- NCERT Solutions for All Subjects
Bond Order
The filled molecular orbital diagram shows the number of electrons in both bonding and antibonding molecular orbitals. The net contribution of the electrons to the bond strength of a molecule is identified by determining the bond order that results from the filling of the molecular orbitals by electrons.
The bond order is calculated by subtracting the destabilizing (antibonding) electrons from the stabilizing (bonding) electrons. Since a bond consists of two electrons, we divide by two to get the bond order. We can determine bond order with the following equation:
bond order = [(number of bonding electrons)−(number of antibonding electrons)]/2
The order of a covalent bond is a guide to its strength; a bond between two given atoms becomes stronger as the bond order increases. If the distribution of electrons in the molecular orbitals between two atoms is such that the resulting bond would have a bond order of zero, a stable bond does not form.
For example, the bond order of H2 molecule is given as follows:

The molecular orbital energy diagram predicts that H2 will be a stable molecule with lower energy than the separated atoms.
A dihydrogen molecule contains two bonding electrons and no antibonding electrons so we have:
bond order in H2=(2−0)/2=1
Because the bond order for the H–H bond is equal to 1, the bond is a single bond.
Also Check-
- NCERT Exemplar Class 11th Chemistry Solutions
- NCERT Exemplar Class 12th Chemistry Solutions
- NCERT Exemplar Solutions for All Subjects
Magnetic Moment
The magnetic behavior of any molecule can be determined from the number of unpaired electrons in the bonding and antibonding orbitals. The molecule is said to be diamagnetic as there is no unpaired electron present in the orbitals and not attracted by the magnet. But if any unpaired electron is present then the molecule is paramagnetic.
For example, O2 molecule has 2 unpaired electrons can be seen from the diagram below:

Therefore, O2 molecule is paramagnetic.
Related Topics-
Recommended topic video on (Energy level diagram)
Also Read:
Some Solved Examples
Example 1: When two atoms of chlorine combine to form one molecule of chlorine gas, the energy of the molecule?
1)Greater than that of the separate atom
2)Equal to that of the separate atom
3) Lower than that of separate atoms
4)None of the above
Solution
Energy level diagram for molecular orbitals. -
1s atomic orbitals combine to give

When bonds form between two atoms then their energy gets lower than that of the separate atom as the bond formation is exothermic.
Example 2: Among the following species, the diamagnetic molecule is :
1) NO
2) CO
3)
4)
Solution
If the molecular orbitals have unpaired electrons then the molecule will be paramagnetic.
or if all are paired then the molecule will be diamagnetic.
In CO, molecular orbital configuration
There are no unpaired electrons thus CO is a diamagnetic.
Hence, the answer is the option (2).
Example 3: Among the following molecules/ions,
1)
2)
3)
4)
Solution
(1) It is diamagnetic
(2) Bond order
(1) It is diamagnetic
(2) Bond Order
Hence, the answer is the option (4).
Example 4: From elementary molecular orbital theory we can give the electronic configuration of the singly positive nitrogen molecule ion N2+ as:
Solution
Energy order for B2, C2, N2, Li2, Be2 -

Example 5: In an oxygen molecule,
1)Mixing of sp orbitals of the two oxygen atoms
2) Non-mixing of an sp orbital of the two oxygen atoms.
3)The inclusion of d- d-orbitals in the molecular orbitals
4)Electronic repulsion between the electrons of the two atoms.
Solution
The energy level diagram for oxygen molecules is:

For most of the elements,
Hence, option number (2) is correct.
Example 6: The total number of anti bonding molecular orbitals, formed from 2s and 2p atomic orbitals in a diatomic molecule is ______. [JEE Main 2024]
Solution:
Antibonding orbital is:
$\sigma 2 \mathrm{~s}^*, \sigma 2 \mathrm{p}^*, \pi 2 \mathrm{p}^*, \pi^* 2 \mathrm{p}$
Hence, the answer is (4).
Practice More Questions From the Link Given Below:
Summary
For atomic systems, these diagrams portray electron configurations within shells and subshells. The molecular orbital diagrams approximate the way atomic orbitals combine to form bonding and antibonding orbitals in molecular systems. This enables one to understand and predict molecular stability, bond order, and magnetic properties.
NCERT Chemistry Notes:
Frequently Asked Questions (FAQs)
In lighter molecules like B₂, C₂, and N₂, the σ(2p) and π(2p) orbitals shift due to s–p mixing, causing π(2p) orbitals to be lower in energy than σ(2p). In heavier molecules like O₂ and F₂, s–p mixing is negligible, and σ(2p) is lower in energy.
Only orbitals of similar energy and symmetry can combine effectively. For example, s–s or pz–pz can overlap head-on to form σ bonds, while px and py overlap side-by-side to form π bonds.
In homonuclear molecules (like O₂ or N₂), atomic orbitals have the same energy, leading to symmetric combinations. In heteronuclear molecules (like CO or NO), atomic orbitals have different energies, creating asymmetric energy level diagrams.
In He₂, both bonding and antibonding orbitals are filled with equal electrons, giving a bond order of zero, which means no net bond formation.
A node is a region where electron density is zero. In antibonding orbitals, the presence of a node between nuclei prevents effective bonding and increases energy.
In bonding orbitals, electron density is concentrated between the nuclei, leading to attractive forces and stabilization. In antibonding orbitals, electron density lies outside the internuclear region, causing repulsion and destabilization.
For lighter diatomic molecules (B₂, C₂, N₂):
σ(1s) < σ*(1s) < σ(2s) < σ*(2s) < π(2px, 2py) < σ(2pz) < π*(2px, 2py) < σ*(2pz)
For heavier diatomic molecules (O₂, F₂, Ne₂):
σ(1s) < σ*(1s) < σ(2s) < σ*(2s) < σ(2pz) < π(2px, 2py) < π*(2px, 2py) < σ*(2pz)
Molecular orbitals are arranged based on their energy. Bonding orbitals are lower in energy and more stable, while antibonding orbitals are higher in energy and less stable.
Atomic energy level diagrams show the arrangement of electrons in atomic orbitals within a single atom, while molecular energy level diagrams show how atomic orbitals combine to form molecular orbitals when atoms bond.
An energy level diagram shows how the energy of electrons varies in different atomic or molecular orbitals. It helps visualize the relative stability and filling order of orbitals in atoms or molecules.
