


CUET PG MBA 2027 Data Interpretation: Important Topics, Preparation Tips and Practice Questions

Can you analyse a chart, compare multiple datasets and calculate percentage changes without wasting valuable exam time? Data Interpretation (DI) tests your ability to understand numerical information and draw accurate conclusions. For CUET PG MBA 2027, candidates should practise different chart types, tables, data sufficiency and Venn diagrams. This article covers important topics, preparation strategies, practice questions with solutions and tips to improve speed and accuracy.

CUET PG MBA 2027 Data Interpretation: Important Topics
Data Interpretation preparation involves reading numerical data, identifying relationships and solving calculation-based questions. Candidates should cover the following topics for the General Paper (MBA etc.), COQP12.
Topic | Important areas to practise |
Pie Charts | Percentages, sector values and comparisons |
Line Charts | Trends, growth and changes over time |
Bar Graphs | Category-wise comparisons and differences |
Tabular Charts | |
Mixed Graphs | Interpreting multiple chart types together |
Data Sufficiency | Evaluating whether information is sufficient |
Graph Number Systems | Numerical relationships represented through graphs |
Tabulation | Organising and analysing numerical information |
Sets and Venn Diagrams | Overlapping groups and set-based calculations |
These topics form the Data Interpretation section of the COQP12 syllabus. No fixed topic-wise question weightage is specified, so candidates should prepare all the listed areas.
CUET PG MBA Exam Pattern 2027
The CUET PG MBA 2027 examination pattern has not yet been confirmed. The previous syllabus information for the General Paper (MBA etc.), COQP12, specifies the following details.
Particulars | Details |
Test paper code | COQP12 |
Paper name | General Paper (MBA etc.) |
Total questions | 75 MCQs (2026 pattern) |
Duration | 90 minutes (2026 pattern) |
Question type | Multiple-choice questions |
Language | Check the applicable NTA information bulletin |
2027 status | Awaiting the official 2027 notification |
The final examination duration, marking scheme and other details should be verified through the official NTA CUET PG website when the 2027 notification becomes available.
CUET PG MBA 2027 Data Interpretation Preparation Strategy
A topic-wise approach helps you build calculation speed and accuracy. Begin with basic calculations and gradually practise questions involving multiple datasets.
1. Pie Charts
Pie charts represent data as parts of a whole. Questions may ask you to calculate the value represented by a sector, compare categories or determine percentage shares.
Preparation tips:
Remember that a complete pie chart represents 100% or 360°.
Practise converting percentages into actual values.
Learn to calculate sector angles and percentage shares.
Compare categories carefully before selecting an answer.
2. Line Charts
Line charts display changes over time and help identify growth, decline and fluctuations.
Preparation tips:
Identify values for the required years or periods.
Distinguish between absolute change and percentage change.
Practise comparing trends across multiple lines.
Check the scale and units before calculating.
3. Bar Graphs
Bar graphs compare quantities across categories. Questions commonly involve totals, differences, ratios and percentage changes.
Preparation tips:
Read the axis labels and units carefully.
Compare the correct bars instead of relying on visual estimates.
Practise ratios, averages and percentage differences.
Check whether the graph shows individual values or grouped totals.
4. Tabular Charts and Tabulation
Tables present information in rows and columns. Questions may require you to combine values from different categories or calculate totals and averages.
Preparation tips:
Locate the correct row and column before calculating.
Pay attention to units such as thousands, lakhs or percentages.
Practise totals, averages, ratios and comparisons.
Avoid using figures from the wrong category.
5. Mixed Graphs
Mixed graphs combine formats such as bar charts and line charts. These questions require you to interpret different types of information together.
Preparation tips:
Understand what each chart represents.
Check whether the charts use different scales or units.
Match the correct categories and time periods.
Solve direct comparisons before attempting multistep calculations.
6. Data Sufficiency
Data sufficiency questions test whether the information provided is enough to answer a question. You must evaluate the statements rather than calculate unnecessarily.
Preparation tips:
Identify exactly what the question asks.
Evaluate each statement independently.
Check whether the statements together provide sufficient information.
Avoid assuming missing values or conditions.
7. Graph Number Systems
Graph Number Systems is another topic listed in the syllabus. Practise numerical relationships and calculations represented through graphs, following the formats used in your preparation material.
8. Sets and Venn Diagrams
Sets and Venn diagrams represent relationships between groups, including members belonging to one or more categories.
Preparation tips:
Identify the total number of elements in each set.
Calculate overlapping groups carefully.
Distinguish between elements belonging to exactly one set and those belonging to multiple sets.
Practise two-set and three-set problems.
CUET PG MBA Data Interpretation Practice Questions 2027
Practise these 10 CUET PG MBA-level Data Interpretation questions covering tables, pie charts, bar graphs, percentages, ratios, averages, data sufficiency and Venn diagrams. Solve each question before checking the answer key and solutions to assess your preparation.
Question 1: Table-Based Data Interpretation
The table shows the number of students enrolled in five MBA coaching centres and the percentage who qualified in a mock examination.
Centre | Students Enrolled | Qualified (%) |
A | 400 | 65% |
B | 500 | 72% |
C | 600 | 55% |
D | 450 | 80% |
E | 550 | 60% |
What is the total number of students who qualified from centres B and D?
A. 620
B. 680
C. 720
D. 750
Question 2: Percentage Change
A company's annual revenue increased from ₹80 lakh in 2024 to ₹100 lakh in 2025. In 2026, revenue decreased by 15% compared with 2025. What was the percentage change in revenue from 2024 to 2026?
A. 5% increase
B. 6.25% increase
C. 6.25% decrease
D. 10% increase
Question 3: Pie Chart-Based Data Interpretation
A company's total annual expenditure is ₹24 lakh, distributed as follows.
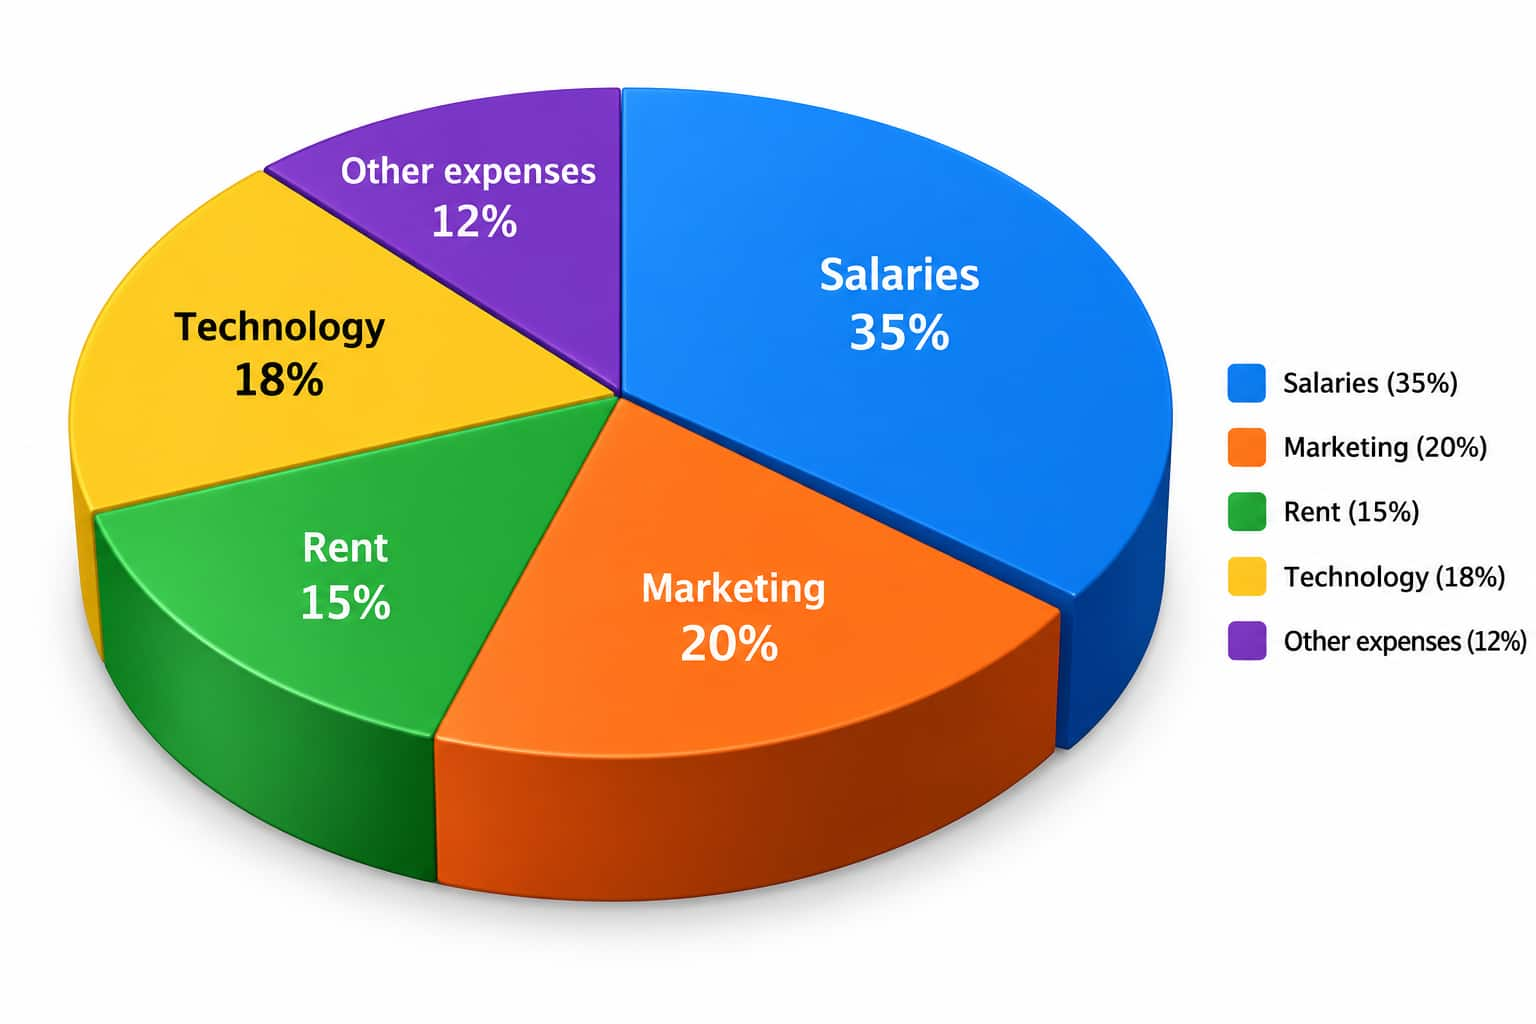
If technology expenditure increases by 25% while all other expenses remain unchanged, what will be the new total expenditure?
A. ₹24.90 lakh
B. ₹25.08 lakh
C. ₹25.20 lakh
D. ₹25.80 lakh
Question 4: Bar Graph Interpretation
The following bar graph shows the number of units sold by a company over four quarters.
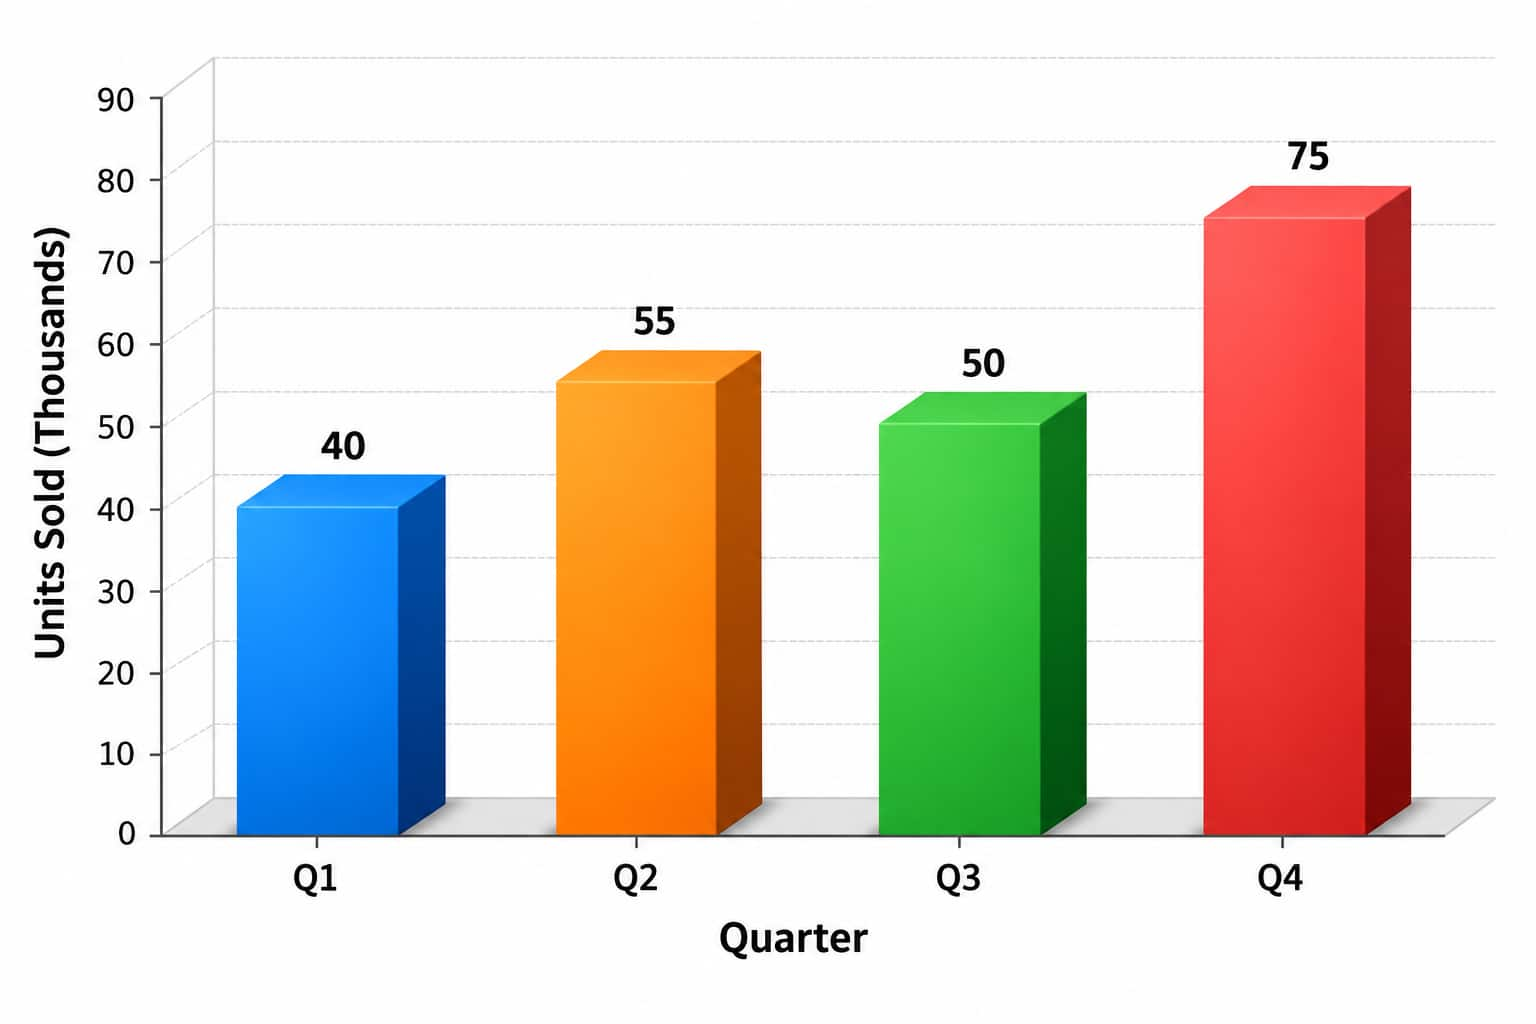
What is the percentage increase in sales from Q1 to Q4?
A. 75%
B. 80%
C. 87.5%
D. 90%
Question 5: Ratio and Proportion
The number of students enrolled in Finance, Marketing and Human Resources programmes is in the ratio 5:4:3. If the total enrolment is 1,440, how many students are enrolled in Marketing?
A. 360
B. 420
C. 480
D. 600
Question 6: Average
The average monthly sales of a retailer for the first four months were ₹1.8 lakh. If sales in the fifth month were ₹2.6 lakh, what was the average monthly sales for all five months?
A. ₹1.90 lakh
B. ₹1.96 lakh
C. ₹2.00 lakh
D. ₹2.10 lakh
Question 7: Data Sufficiency
What is the total number of employees in a company?
Statement I: The ratio of male to female employees is 7:5.
Statement II: The number of male employees exceeds the number of female employees by 80.
Which statement or combination of statements is sufficient to answer the question?
A. Statement I alone
B. Statement II alone
C. Both statements together
D. Neither statement, even together
Question 8: Mixed Data Interpretation
A university has 2,400 students. Of these, 40% study Management, 25% study Commerce, 20% study Economics, and the remaining students study other subjects. If 30% of the Management students are female, how many female Management students are there?
A. 240
B. 288
C. 300
D. 360
Question 9: Sets and Venn Diagrams
In a survey of 200 MBA aspirants, 120 read business newspapers, 90 read business magazines, and 50 read both. How many aspirants read neither newspapers nor magazines?
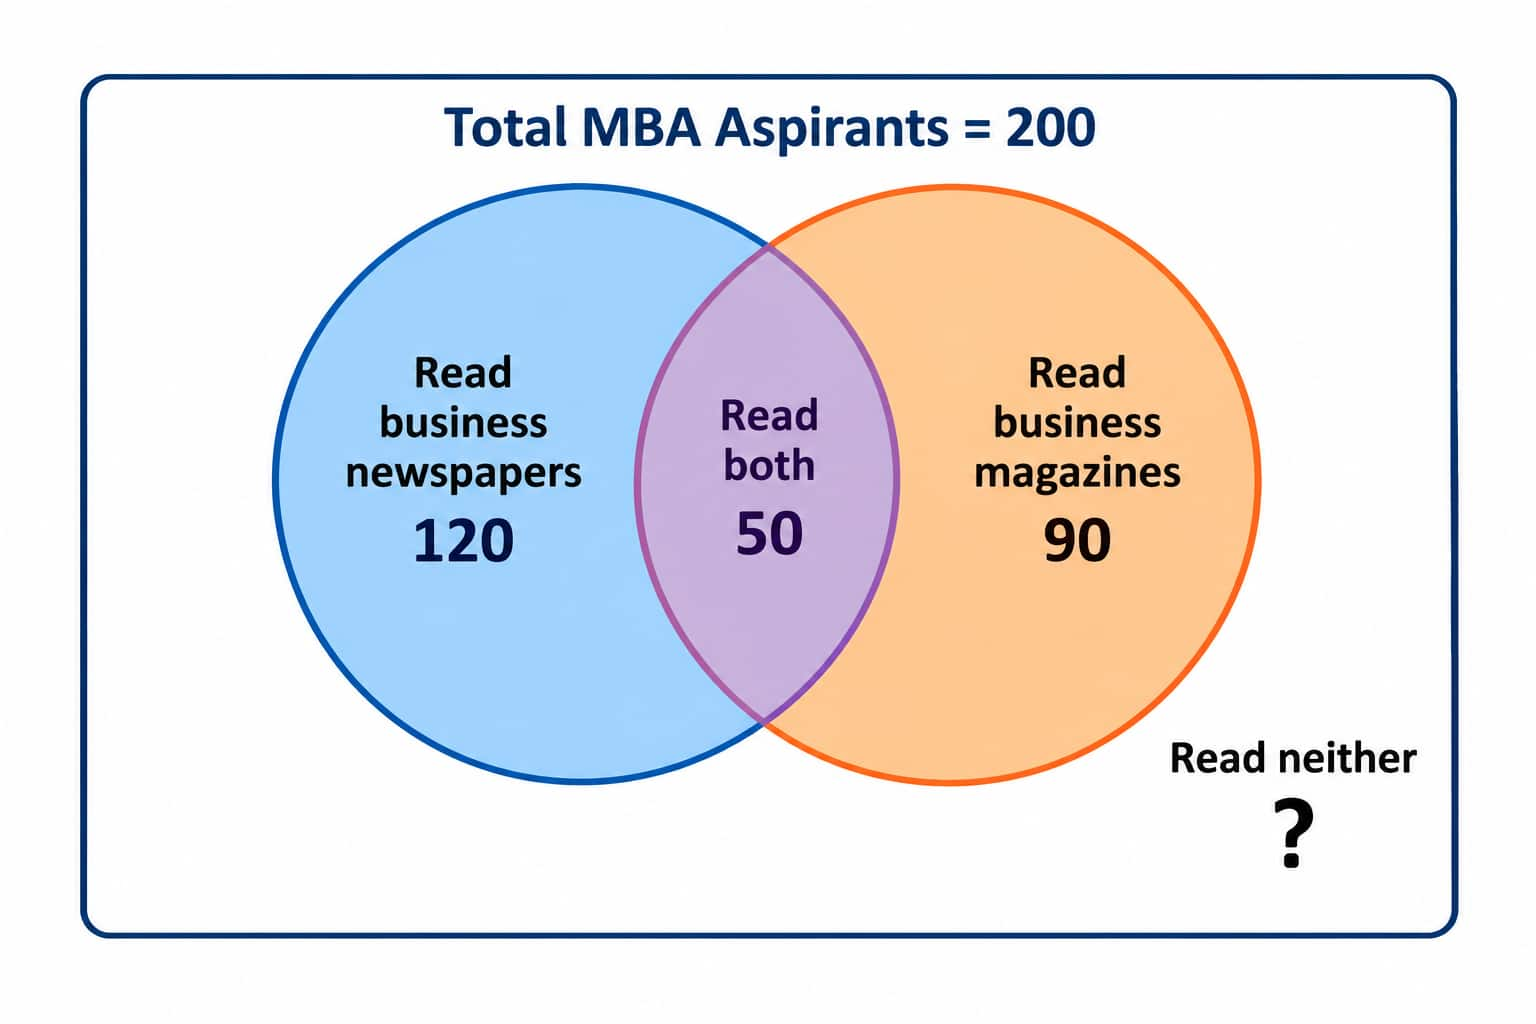
A. 20
B. 30
C. 40
D. 50
Question 10: Compound Percentage Change
A company's workforce increased by 20% in the first year and decreased by 10% in the second year. If the initial workforce was 5,000 employees, how many employees were there after two years?
A. 5,200
B. 5,300
C. 5,400
D. 5,500
CUET PG MBA 2027 Data Interpretation Preparation Tips
Follow these practical suggestions to improve your calculation speed and accuracy.
Strengthen calculation basics: Revise percentages, ratios, averages and fractions.
Practise daily: Solve questions from different DI topics instead of focusing on only one chart type.
Read charts carefully: Check headings, units, scales and categories before calculating.
Simplify calculations: Use estimation and mental arithmetic when appropriate.
Review mistakes: Identify whether errors occurred due to calculation or misinterpretation.
Attempt timed practice: Introduce time limits gradually after developing accuracy.
CUET PG MBA 2027 Useful Resources
Explore useful CUET PG MBA 2027 preparation resources, including topic-wise practice questions, solved question papers, vocabulary lists, and English, Quantitative Aptitude, Data Interpretation, and Logical Reasoning PDFs to strengthen your concepts and improve exam readiness.
CUET PG MBA 2027: Data Interpretation Questions with Solutions PDF | |
CUET PG MBA 2027: Quantitative Aptitude/ Maths Questions with Solutions PDF | |
CUET PG MBA 2027 Vocabulary List PDF | |
CUET PG MBA 2027 English PDF | |
CUET PG MBA 2027 Question Paper with Solutions | |
CUET PG MBA 2026 Memory Based Questions with solutions and Analysis | |
CUET PG MBA 2027 Quantitative Aptitude: Concepts, Topic-Wise Practice Questions PDF | |
CUET PG MBA 2027 Logical Reasoning:Topic-Wise Practice Questions PDF | |
CUET PG MBA 2026 Official Question Paper | |
CUET PG MBA 2023 Question Paper |
Frequently Asked Questions (FAQs)
The important topics include Pie Charts, Line Charts, Bar Graphs, Tabular Charts, Mixed Graphs, Data Sufficiency, Graph Number Systems, Tabulation, and Sets and Venn Diagrams.
Yes. Data Interpretation is listed as a separate section in the General Paper (MBA etc.), COQP12 syllabus.
Practise percentages, ratios, averages and graph-based calculations. Solve timed question sets and review mistakes to improve speed and accuracy.
No. The syllabus lists the topics but does not specify individual topic-wise question counts or weightage.
Visit the official NTA CUET PG website for the latest information bulletin, syllabus and examination updates.