

Venn Diagram: Meaning, Reasoning Questions and Answers, Formula, Examples
Have you ever tried comparing groups like students who play cricket, football, or both - and wondered how to show it clearly? That’s where Venn diagrams come in. In reasoning exams, Venn diagram questions help you understand relationships between different sets using simple circles and logical thinking. These questions may look easy, but they require careful analysis to avoid mistakes. With the right Venn diagram reasoning tricks and formulas, solving Venn diagram reasoning questions becomes quick and accurate. In this article, we’ll cover the meaning of Venn diagram, important formulas, different types of Venn diagram questions with answers, and explain them with clear examples and shortcuts to help you master this topic for competitive exams. Venn diagram questions are asked regularly in exams like SSC, Banking, Railways, CAT, CUET, Defence exams, MCA entrance tests, and other aptitude-based competitive exams.
This Story also Contains
- Venn Diagram in Reasoning: Meaning, Questions, Formula, Examples & Tricks
- Basic Concepts of Venn Diagram and Set Theory in Reasoning
- Types of Venn Diagram Reasoning Questions (SSC, Banking & Competitive Exams Guide)
- Practice Resources for Venn Diagram
- Practice Questions based on a Venn Diagram PDF Download
- Venn Diagram Reasoning Practice Questions For Venn Diagram to Relation
- Venn Diagram Reasoning Practice Questions For Relation to Venn Diagram
- Venn Diagram Reasoning Practice Questions For Caselets
- Venn Diagram Reasoning Practice Questions For the Representation-based Venn Diagram
- Venn Diagram Reasoning Questions for AP ICET/ IBSAT
- Venn Diagram Reasoning Questions for KMAT/ UPESMET/ JIPMAT
- Best Books for Venn Diagram Reasoning & Logical Reasoning Preparation (SSC, Banking, RRB Exams)
- Verbal Reasoning Topics
- Venn Diagram Important Formulae
- Venn Diagram Reasoning Questions for SSC CHSL/ SSC Stenographer/ SSC CGL/ SSC CPO exams
- Venn Diagram Reasoning Questions for IBPS CWE Clerical/ IBPS RRB Assistant/ Railway Recruitment Board exams
- How to Solve Logical Venn Diagram Questions
- Non-Verbal Reasoning Topics
Venn Diagram in Reasoning: Meaning, Questions, Formula, Examples & Tricks
Venn diagram reasoning is an important topic in logical reasoning that helps you understand relationships between different groups or sets. Using simple circles, Venn diagram questions visually represent data, making it easier to solve problems related to classification, comparison, and set theory. With proper understanding of Venn diagram formulas and regular practice of Venn diagram questions with answers, you can solve these questions quickly in SSC, Banking, and other competitive exams.
What is Venn Diagram in Reasoning? Definition and Basic Concept
A Venn diagram is a graphical representation of sets using circles, where each circle represents a group and overlapping regions show common elements.
Understanding Venn Diagram with Easy Explanation
In Venn diagram reasoning questions, different categories (like students, players, or subjects) are shown using circles. The overlapping parts indicate common elements, while non-overlapping parts represent unique elements.
Key Features of Venn Diagram Questions
Uses circles to represent sets
Shows relationships like common and distinct elements
Widely used in logical reasoning and set theory questions
Common in SSC Venn diagram questions and banking exams
Importance of Venn Diagram Questions for SSC, Banking & Competitive Exams
Venn diagram is a scoring topic in reasoning sections of competitive exams.
Why Venn Diagram Questions are Important for Exams
Frequently asked in SSC CGL, CHSL, IBPS, SBI, and RRB exams
Helps test logical thinking and analytical ability
Easy to solve with proper Venn diagram tricks and formulas
Why Venn Diagram is a High-Scoring Topic
Less time-consuming compared to puzzles
Simple concepts with high accuracy
Can be solved quickly using Venn diagram formulas
Basic Concepts of Venn Diagram and Set Theory in Reasoning
Understanding basic set theory Venn diagram concepts is essential for solving all types of Venn diagram reasoning questions.
Understanding Sets, Subsets, and Universal Set in Venn Diagram
Set in Venn Diagram Reasoning
A set is a collection of objects, numbers, or elements. Each circle in a Venn diagram represents a set.
Subset Concept in Venn Diagram
A subset is a part of a larger set. In diagrams, one circle may lie completely inside another, representing subset relationships.
Universal Set in Venn Diagram Questions
The universal set includes all elements under consideration and is usually represented by a rectangle enclosing all circles in Venn diagram questions.
Union, Intersection, and Complement in Venn Diagram (Key Formulas & Concepts)
Union of Sets (A ∪ B)
Represents all elements belonging to either set A or set B or both. It includes the entire area of both circles.
Intersection of Sets (A ∩ B)
Represents common elements between sets A and B. It is shown by the overlapping region in Venn diagram reasoning questions.
Complement of a Set (A')
Represents elements that are not in set A but are part of the universal set. It is the area outside the circle.
These concepts are widely used in Venn diagram formula-based questions.
Types of Venn Diagram Reasoning Questions (SSC, Banking & Competitive Exams Guide)
Understanding the different types of Venn diagram reasoning questions is essential to solve problems quickly and accurately. In exams, Venn diagram questions with answers are asked in various formats, testing your ability to interpret relationships, classify data, and apply Venn diagram formulas and tricks effectively.
Venn Diagram for a Relation (Set-Based Representation Questions)
These are the most common Venn diagram reasoning questions, where you are given a relationship and asked to represent it using a diagram.
What are Relation-Based Venn Diagram Questions?
In these questions, statements like “All A are B” or “Some B are C” are given, and you need to choose the correct diagram that represents the relationship.
How to Solve Relation-Based Venn Diagram Questions
Identify keywords like all, some, none
Translate statements into set relationships
Match with the correct Venn diagram representation
These questions are frequently asked in SSC Venn diagram reasoning questions.
Relation to Venn Diagram Questions (Reverse Logic Type)
These questions are the opposite of the above type.
What are Reverse Venn Diagram Questions?
A diagram is given, and you need to identify which statement or relationship it represents.
How to Solve Reverse Venn Diagram Questions
Observe overlapping and non-overlapping regions
Identify relationships between sets
Match with the correct statement
This type tests your understanding of set theory Venn diagram concepts.
Caselet-Based Venn Diagram Questions (Data Interpretation Type)
These are slightly advanced Venn diagram reasoning questions.
What are Caselet Venn Diagram Questions?
A paragraph or data set is given with information about different groups, and you need to represent or analyze it using a Venn diagram.
How to Solve Caselet-Based Questions
Extract key data from the passage
Convert information into sets
Apply Venn diagram formulas to find answers
These are common in banking and higher-level reasoning exams.
Representation-Based Venn Diagram Questions (Logical Classification)
These questions focus on classification and grouping.
What are Representation-Based Venn Diagram Questions?
You are given categories like “Fruits, Apples, Mangoes” or “Students, Boys, Girls,” and asked to choose the correct diagram representing their relationship.
How to Solve Representation-Based Questions
Identify subset or overlapping relationships
Check if categories are independent or related
Choose the correct Venn diagram representation
These are widely asked in logical reasoning Venn diagram questions.
Let’s discuss these types in detail with the help of examples -
1. Venn Diagram to Relation
In this type of Venn diagram, a Venn diagram will be given, and we have to determine the most suitable group of words that matches the relationship with the given Venn diagram. Let’s understand the concept with the help of Venn diagram examples with solutions.
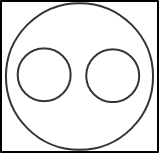
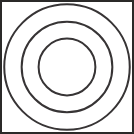
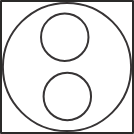
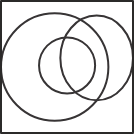
Example: Select the set of classes and the relationship among them that is best illustrated by the Venn diagram given below.

A) Shoes, Watches, Goggles
B) Spectacles, Pens, Diaries
C) Reptiles, Snakes, Lizards
D) Daughter, Son, Brother
Answer: To identify the words associated with the given Venn diagram, let's analyse the diagram. The diagram consists of two small circles within a larger circle, indicating that the two circles belong to the same category represented by the larger circle. Since the two small circles do not intersect or overlap, they do not share any similarities. Now, if we check the options, it is clear that only the third option satisfies the condition stated by the given Venn diagram. In this case, both snakes and lizards fall under the category of reptiles and are not interconnected.
2. Relation to Venn Diagram
In this type of Venn diagram, a group of words will be given and we have to find the most suitable Venn diagram that represents the possible relationship between the given words. Let’s understand the concept with the help of Venn diagram examples with solutions.
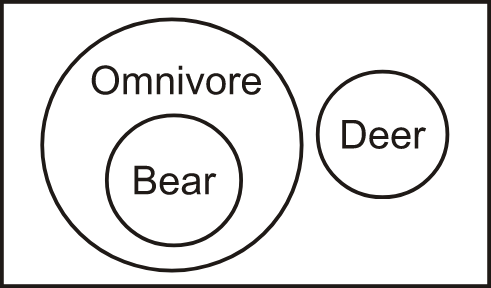
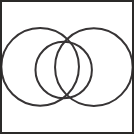
Example: Determine the Venn diagram that represents the relationship between Omnivores, Bear, and Deer.
Answer: As we know, Deer only eats grass. This means that deer is a herbivore and not an omnivore. But, a Bear is both a carnivore and herbivore, i.e., a Bear is an omnivore. So, all bears are omnivores while no deer is omnivore. Deer and bears are not related to each other. So, the circle representing the bear will lie inside the circle representing the omnivore, and the circle representing the deer will be drawn separately.
So, the Venn diagram is –
3. Caselets
Data Caselet questions are mostly seen in the reasoning section of the CAT exam. This topic is very important from the CAT exam and bank exams point of view. In these types of questions, candidates are given a caselet and a set of questions are asked based on the given caselet. A data caselet is basically a paragraph that contains certain data or information. No charts or graphs are provided with the data. We have to organise the data from the caselet and then solve the related set of questions. Some questions can be solved by using the table and some questions can be solved directly just by interpreting the data. Some of the questions are solved using the Venn diagrams. The questions are easily solvable as only basic mathematical concepts are used to answer most of the questions.
Example: In a batch of 60 students, 50% of the students scored more than 80% and 70% scored more than 50% in a test. There were 10% of the students who scored less than 15 on that test. How many students scored between 15 and 60 marks if the total marks were 75?
Solution: Total marks = 75
80% of 75 = (80/100) × 75 = 60
Students who scored more than 60 = 50% of 60 = 30 —---- (I)
Students who scored less than or equal to 60 = 30 —---- (II)
Students who scored less than 15 = 10% of 60 = 6 —---- (III)
Now, on subtracting equation (III) from equation (II), we will get the students who score between 15 and 60.
So, students who scored between 15 and 60 = 30 - 6 = 24
4. Representation-Based Venn Diagram
In this type of Venn diagram, a Venn diagram will be given with different geometrical shapes indicating different categories with one or more than one numbers in each figure. In this, we have to identify how many persons belong to different categories according to the given conditions. Let’s understand the concept with the help of Venn diagram examples with solutions.
Example: In the given figure, how many people like cricket and tennis?
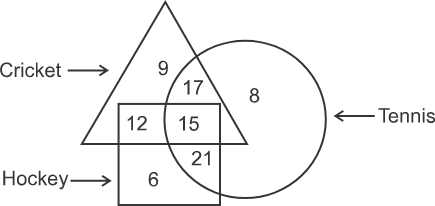
Answer: To get the number of people who like cricket and tennis, determine the sum of the numbers falling in the part of the diagram where the regions representing Cricket, Hockey and Tennis overlap. In the below diagram, the shaded part represents the region common to both cricket and tennis as well as hockey. The numbers of the asked fields that fall in the hockey region will also be counted as there is no direction given that the region belonging to hockey can not be included.
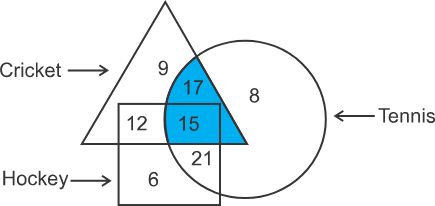
The total number of people who like cricket and tennis both = 17 + 15 = 32
Therefore, 32 people like both cricket and tennis. Hence, the second option is correct.
Practice Resources for Venn Diagram
The following are the recommended sources for the practice of the questions of the Venn diagram -
a) A Modern Approach to Verbal & Non-Verbal Reasoning by R.S. Aggarwal
b) Analytical Reasoning by M.K. Pandey
c) Logical and Analytical Reasoning by A.K. Gupta
d) Test of Reasoning by Edgar Thorpe
Question Weightage of Venn Diagram in Competitive Exams
The number of questions based on the Venn diagram varies from exam to exam -
1) Questions asked in SSC exams, i.e. SSC MTS, SSC CGL, SSC CHSL, SSC CPO, Steno - 2 to 3 questions.
2) Questions asked in the RRB exam, i.e. RRB Group D, NTPC, JE, ALP, etc - 2 to 3 questions.
3) Questions asked in Banking exams, Bank PO, Bank Clerk - 1 to 2 questions.
Practice Questions based on a Venn Diagram PDF Download
For practice Venn diagram questions, understanding Venn diagram meaning, Venn diagram symbols, Venn diagram reasoning tricks, Venn diagram formula, candidates must download the logical Venn diagram reasoning questions with solutions PDF below:
Download Now: Venn Diagram Questions with Solutions PDF
Venn Diagram Reasoning Practice Questions For Venn Diagram to Relation
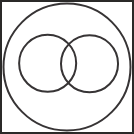
Q1. Directions: Select the set of classes and the relationship among them that is best illustrated by the Venn diagram given below.
A) Fruits, Mango, Apple (Correct)
B) Eatables, Vegetables, Potato
C) Pen, Eraser, Sharpener
D) Brother, Husband, Man
Solution: To identify the words associated with the given Venn diagram, let's analyse the diagram. The diagram consists of two small circles within a larger circle, indicating that the two circles belong to the same category represented by the larger circle. Since the two small circles do not intersect or overlap, they do not share any similarities. Now, if we check the options, it is clear that only the first option satisfies the condition stated by the given Venn diagram. In this case, both mango and apple fall under the category of fruits and are not interconnected.
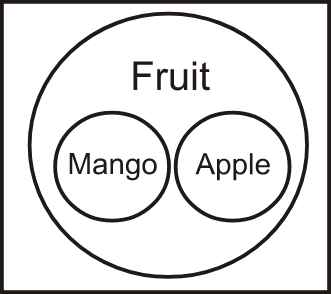
Hence, the first option is correct.
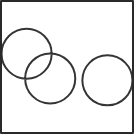
Q2. Directions: Select the set of classes and the relationship among which is best illustrated by the Venn diagram given below.
A) Husband, Father, Man
B) Man, Woman, Human
C) Brother, Man Woman (Correct)
D) Vegetable, Fruit, Eatables
Solution: To identify the words associated with the given Venn diagram, let's analyse the diagram. The diagram consists of one small circle within a larger circle, indicating that the smaller circle belongs to the category represented by the larger circle. Also, there is one separate circle from the two circles, indicating that this circle belong to a different category. Now, if we check the options, it is clear that only the third option satisfies the condition stated by the given Venn diagram. In this case, the brother falls under the category of man. But the woman is a different category.
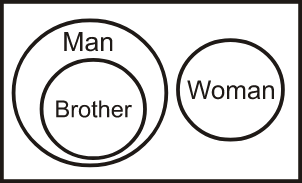
Hence, the third option is correct.
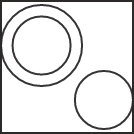
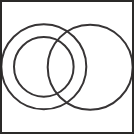
Q3. Directions: Select the set of classes and the relationship among which is best illustrated by the Venn diagram given below.

A) Parents, Mothers, Fathers
B) Females, Sisters, Teachers
C) Women, Wives, Sisters (Correct)
D) Humans, Women, Men
Solution: To identify the words associated with the given Venn diagram, let's analyse the diagram. The diagram consists of one small circle within a larger circle, indicating that the smaller circle belongs to the category represented by the larger circle. Also, one more circle overlaps two circles, indicating that this circle shares some common properties. Now, if we check the options, it is clear that only the second option satisfies the condition stated by the given Venn diagram. In this case, it is quite evident that all the sisters belong to the category of females. Those who are teachers can either be male or female and some of them can also be sisters. So, the circle representing teachers will overlap with the circles representing sisters and females.
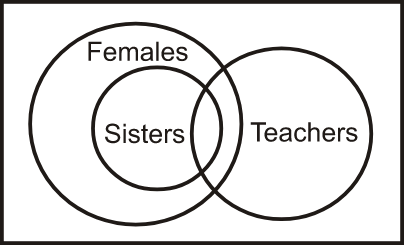
Hence, the third option is correct.
Q4. Directions: Select the set of classes and the relationship among which is best illustrated by the Venn diagram given below.
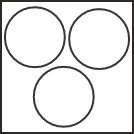
A) Colours, Red, Green
B) Notebook, Stationery, Uniform
C) Pen, Pencil, Stationery
D) Pen, Pencil, Eraser (Correct)
Solution: To identify the words associated with the given Venn diagram, let's analyse the diagram. The diagram consists of three non-overlapping circles, indicating that all three circles are different from each other and do not share any common features. Now, if we check the options, it is clear that only the fourth option satisfies the condition stated by the given Venn diagram. In this case, it is quite evident that Pen, Pencil and Eraser are stationery items but are not interconnected.
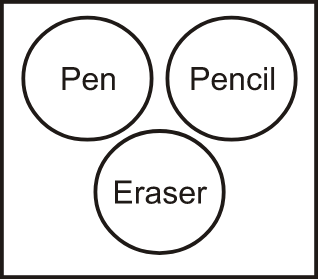
Hence, the fourth option is correct.
Q5. Directions: Select the set of classes and the relationship among which is best illustrated by the Venn diagram given below.

A) Sportsmen, Cricketers, Batsman
B) Material, Cement, Wood
C) Police, Thief, Criminal (Correct)
D) Teacher, Dramatist, Painter
Solution: To identify the words associated with the given Venn diagram, let's analyse the diagram. The diagram consists of one small circle within a larger circle, indicating that the smaller circle belongs to the category represented by the larger circle. Also, there is one separate circle from the two circles, indicating that this circle belong to a different category. Now, if we check the options, it is clear that only the third option satisfies the condition stated by the given Venn diagram. In this case, the thief falls under the category of criminal. But the police belong to a different category.
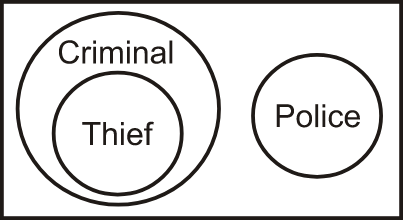
Hence, the third option is correct.
Venn Diagram Reasoning Practice Questions For Relation to Venn Diagram
Q1. Directions: Which of the following diagrams represents the relationship among Sweets, Ladoo, and Jalebi?
A) 
B) 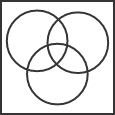
C)  (Correct)
D) 
Solution: Both Ladoo and Jalebi are Sweets. So, all Ladoo are sweets and all Jalebi are sweets. So, the circles representing Ladoo and Jalebi will lie inside the circle representing Sweets. But, Jalebi and Ladoo are not related to each other. So, their circles will not intersect with each other.
The Venn diagram will be –
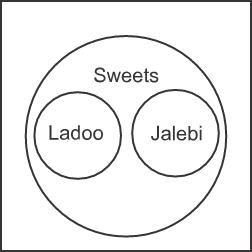
Hence, the third option is correct.
Q2. Directions: Which of the following diagrams represents the relationship among the given classes?
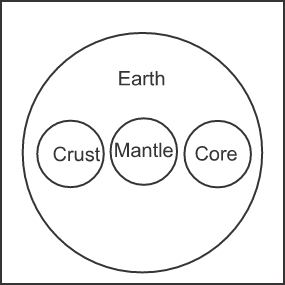
Earth, Crust, Mantle, Core
A) 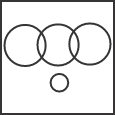
B) 
C)  (Correct)
D) 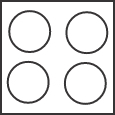
Solution: Earth is the name given to the entire planet. Its outermost layer is called the crust, while the layer beneath the crust is known as the mantle. The core is located at the centre of the Earth. Although the crust, mantle, and core are all parts of Earth, they are not directly related to each other. So, all three circles representing the crust, the mantle, and the core will lie inside the circle representing Earth.
So, the Venn diagram is –
Hence, the third option is correct.
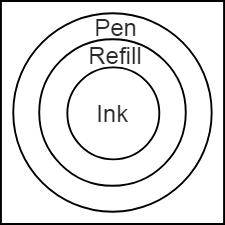
Q3. Directions: Which of the following diagrams represents the relationship between Pen, Ink, and Refill?
A) 
B) 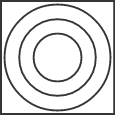 (Correct)
C) 
D) 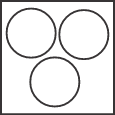
Solution: We know that ink is present inside a refill. So, the circle that represents ink will lie inside the circle that represents refill. Also, a refill is present inside a pen. So, the circle representing refill will lie inside the circle representing the pen.
The Venn diagram will be –
Hence, the second option is correct.
Q4. Directions: Which of the following diagrams represents the relationship between Kidney, Foot, and Head?
A) 
B)  (Correct)
C) 
D) 
Solution: The kidney, foot, and head are all different parts of the human body. They are not related to each other in any manner. So, their circles will be drawn separately.
So, the correct Venn diagram is –
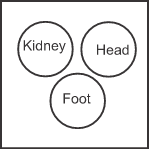
Hence, the second option is correct.
Q5. Directions: In the following question, identify the diagram that represents the best relationship among the classes given below.
Children, Serious, Naughty
A) 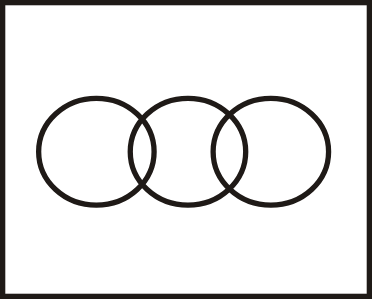 (Correct)
B) 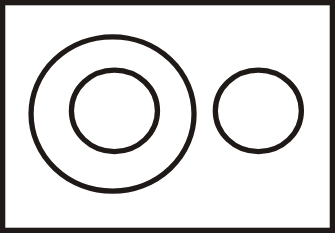
C) 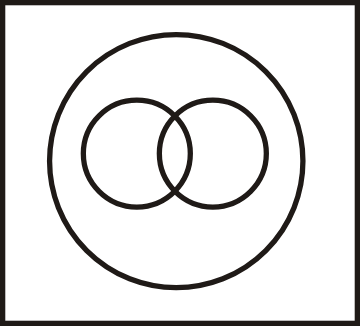
D) 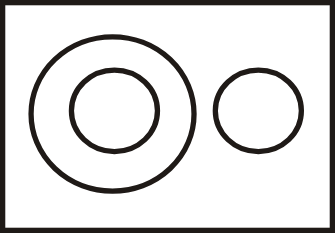
Solution: Children can either be serious or naughty. So, the circle of children will have an overlapping with the circles of serious and naughty. But no one can be serious and naughty at the same time. So, both the circles will not have any direct relationship with each other.
Therefore, the Venn diagram is as follows –
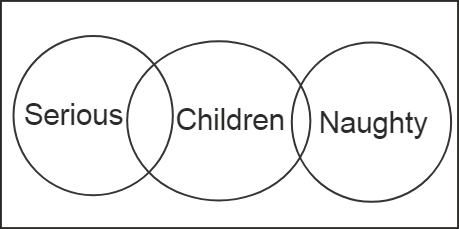
Hence, the first option is correct.
Venn Diagram Reasoning Practice Questions For Caselets
Q1. Directions: At a certain school, each of the 150 students takes at least 1 of the three 3 classes. The 3 classes available are English, Hindi, and Spanish. 60 students study English, 85 study Hindi, and 52 study Spanish. If 5 students take all 3 classes, then how many take exactly 2 classes?
A) 22
B) 25
C) 31
D) 37 (Correct)
Solution: Based on the above-given data, let’s consider the following Venn diagram:
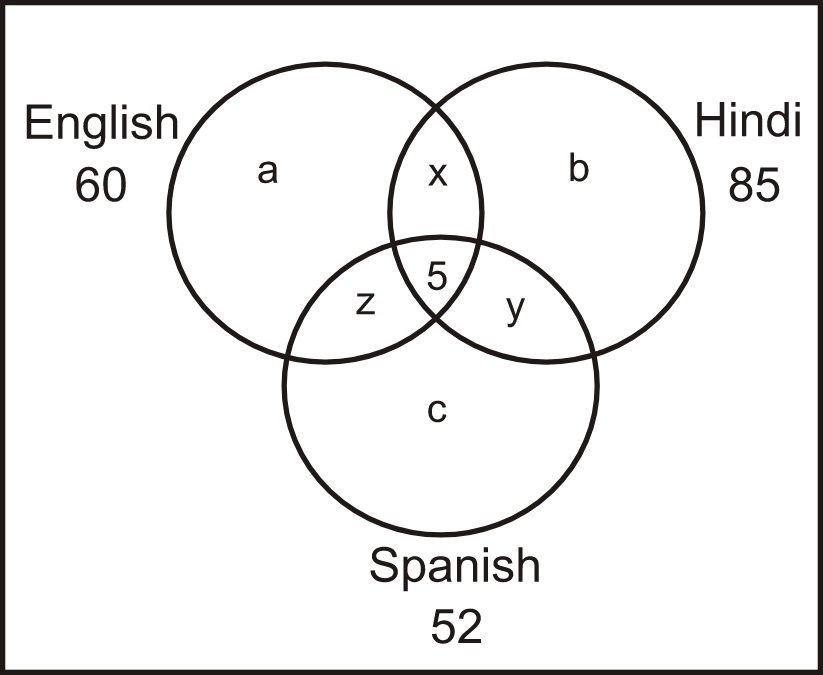
According to the diagram,
a + b + c + x + y + z + 5 = 150
a + b + c + x + y + z = 145 —------(I)
Also, a + b + c + 2(x + y + z) + 3(5) = 60 + 85 + 52
a + b + c + 2(x + y + z) + 15 = 197
a + b + c + 2(x + y + z) = 182 —------(II)
To get the number of students who take exactly 2 classes, subtract equation (I) from the (II).
(x + y + z) = 182 - 145 = 37
So, 37 students took exactly 2 subjects. Hence, the fourth option is correct.
Q2. In a locality, there are a total of 500 families. Each family reads at least 1 newspaper. It is known that 250 families read ‘The Hindu’, 180 families read ‘Times of India’, and 200 families read ‘Indian Express’. If it is known that exactly 50 families read all three newspapers then how many families read exactly 2 newspapers?
A) 22
B) 30 (Correct)
C) 35
D) 27
Solution: Based on the above-given data, let’s consider the following Venn diagram:
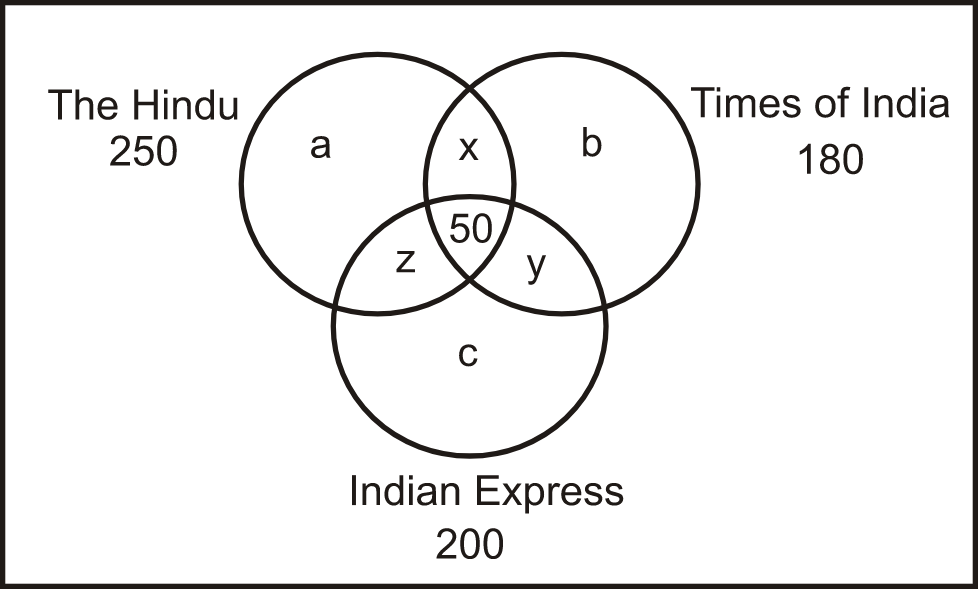
According to the diagram,
a + b + c + x + y + z + 50 = 500
a + b + c + x + y + z = 450 —------(I)
Also, a + b + c + 2(x + y + z) + 3(50) = 250 + 180 + 200
a + b + c + 2(x + y + z) + 150 = 630
a + b + c + 2(x + y + z) = 480 —------(II)
To get the number of students who take exactly 2 classes, subtract equation (I) from the (II).
(x + y + z) = 480 - 450 = 30
So, 30 families read exactly 2 newspapers. Hence, the second option is correct.
Q3. Directions: There are 450 students in a college. Each student has to choose one or more electives out of economics, geography, and math. Further, the following information is also known:
1. 80 students selected only economics and math.
2. 91 students selected only economics and geography.
3. 60 students selected only math and geography.
4. The number of students who selected only geography is 145 less the number of students who selected only economics.
5. In total 250 students selected economics as an elective.
6. In total 255 students selected geography as an elective.
How many students selected both math and economics as electives?
A) 85
B) 91
C) 95
D) 99 (Correct)
Solution: Let ‘x’ be the number of students who took all the three electives and ‘y’ be the number of students who took only economics as an elective. Based on the given information, the Venn diagram is as follows:
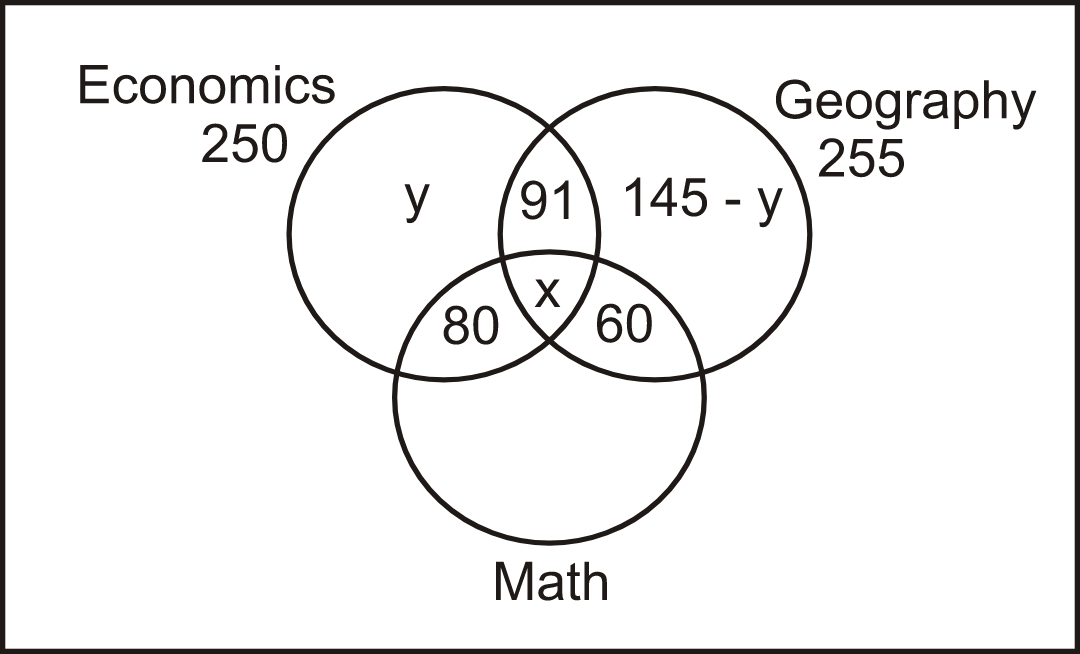
Let’s consider the students who took economics as an elective, we have,
91 + 80 + x + y = 250 ⇒ x + y = 79 —-------(I)
Let’s consider the students who took geography as an elective, we have,
91 + x + 60 + 145 - y = 255 ⇒ y - x = 41 —-------(II)
Adding both the equations, we get, 2y = 120 ⇒ y = 60
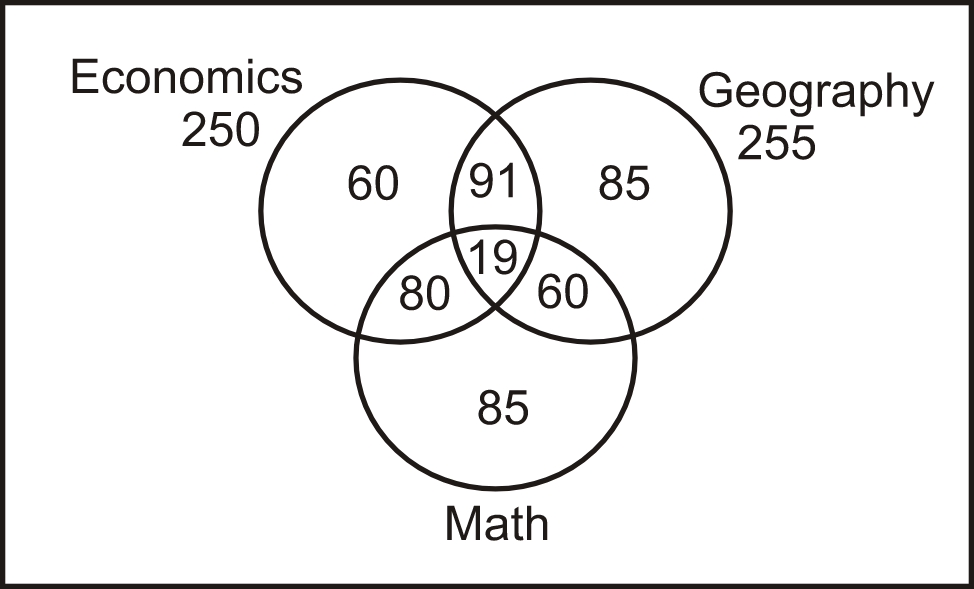
So, x = 19
So, number of students who took all the three as electives = 19
Number of students who took only economics as an elective = 60
Number of students who took only geography as an elective = 85
Number of students who took only math as an elective = 450 - 255 - 60 - 80 = 55
Thus, we got the following Venn diagram:

Number of students who selected both economics and math as electives = 80 + 19 = 99
Hence, the fourth option is correct.
Q4. Directions: There are 450 students in a college. Each student has to choose one or more electives out of economics, geography, and math. Further, the following information is also known:
1. 80 students selected only economics and math.
2. 91 students selected only economics and geography.
3. 60 students selected only math and geography.
4. The number of students who selected only geography is 145 less the number of students who selected only economics.
5. In total 250 students selected economics as an elective.
6. In total 255 students selected geography as an elective.
How many students selected only economics as an elective?
A) 80
B) 60 (Correct)
C) 55
D) 19
Solution: Let ‘x’ be the number of students who took all the three electives and ‘y’ be the number of students who took only economics as an elective. Based on the given information, the Venn diagram is as follows:

Let’s consider the students who took economics as an elective, we have,
91 + 80 + x + y = 250 ⇒ x + y = 79 —-------(I)
Let’s consider the students who took geography as an elective, we have,
91 + x + 60 + 145 - y = 255 ⇒ y - x = 41 —-------(II)
Adding both the equations, we get, 2y = 120 ⇒ y = 60
So, x = 19
So, number of students who took all the three as electives = 19
Number of students who took only economics as an elective = 60
Number of students who took only geography as an elective = 85
Number of students who took only math as an elective = 450 - 255 - 60 - 80 = 55
Thus, we got the following Venn diagram:
Number of students who selected only economics as an elective = 60
Hence, the second option is correct.
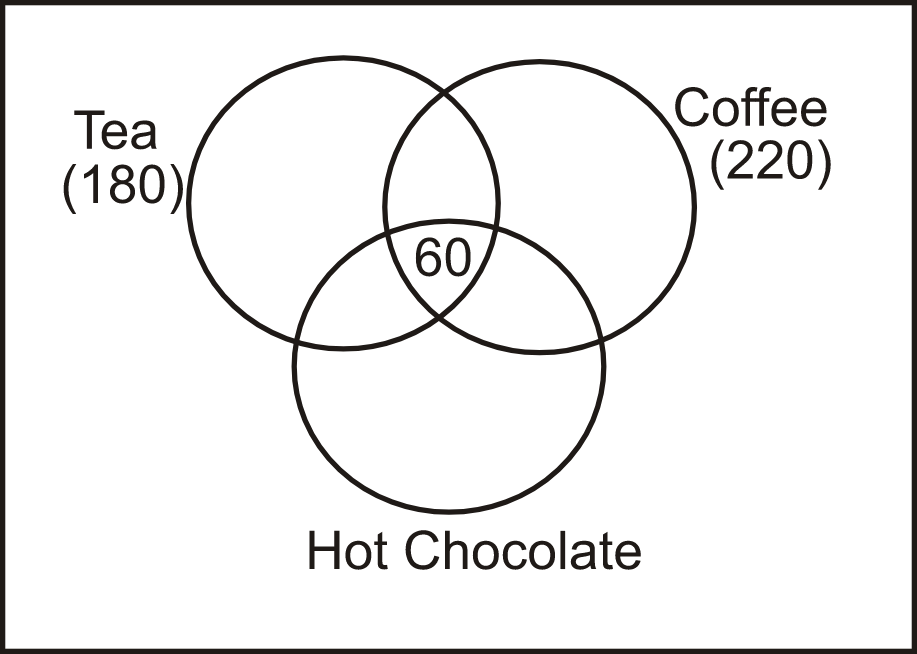
Q5. Directions: 500 people are living in a particular village. There are three drinks Tea, Coffee, and Hot chocolate available in the village. Each citizen has to vote for one or more of the three drinks which he/she likes. It is known that:
1. In total 180 people like Tea and 220 people like Coffee.
2. 60 people like all the three drinks.
3. 80 people like both Tea and Hot chocolate.
4. 79 people like both Hot chocolate and Coffee.
5. 91 people like both Tea and Coffee.
How many people like only Tea?
A) 69 (Correct)
B) 59
C) 60
D) 70
Solution: According to the given information, 46 people like all three drinks. For the given data, the Venn diagram is as follows:
Since, 80 people like both Tea and Hot chocolate. So, the number of people who like only Tea and Hot chocolate = 80 - 60 = 20
Since, 79 people like both Hot chocolate and Coffee. So, the number of people who like only Hot chocolate and Coffee = 79 - 60 = 19
Since, 91 people like both Tea and Coffee. So, the number of people who like only Tea and Coffee = 91 - 60 = 31
Thus, we got the following Venn diagram:
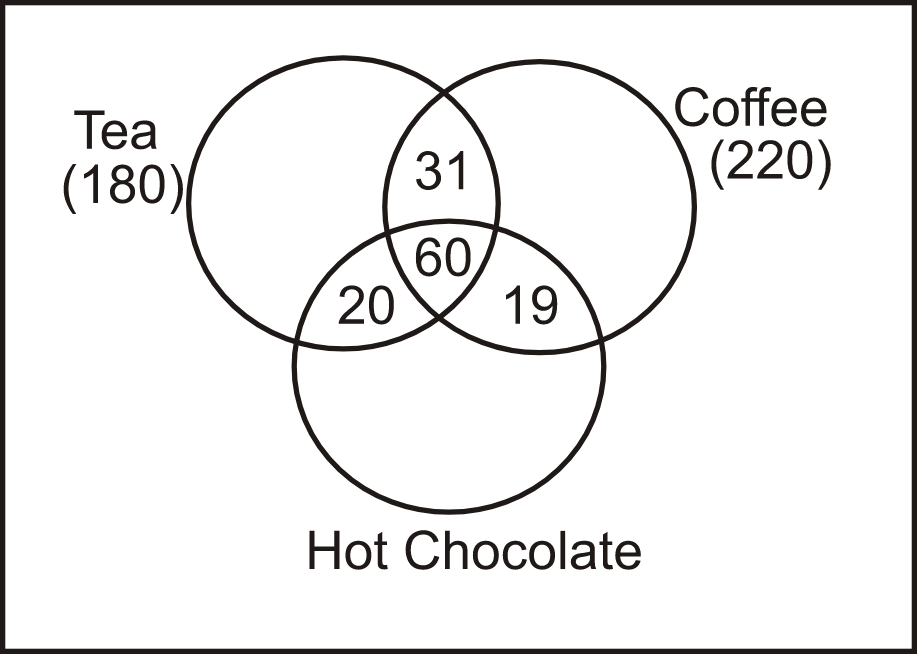
So, the number of people who like only Tea = 180 - 20 - 60 - 31 = 69
Hence, the first option is correct.
Venn Diagram Reasoning Practice Questions For the Representation-based Venn Diagram
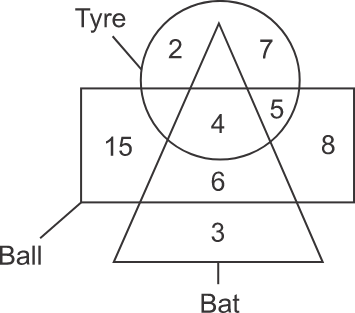
Q1. Directions: How many balls are neither the bat nor the tyre?
A) 15
B) 21
C) 23 (Correct)
D) 8
Solution: To get the number of balls that are neither the bat nor the tyre, determine the sum of numbers present in the region of balls that are neither part of the region of the tyre nor the bat. In the diagram given below, the shaded part represents the region common to balls but uncommon to tyres and bats.
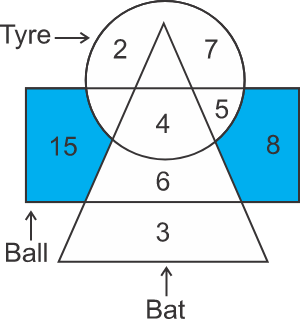
Therefore, the number is→15 + 8 = 23
So, from the above, the total number of balls that are neither tyre nor bat is 23. Hence, the third option is correct.
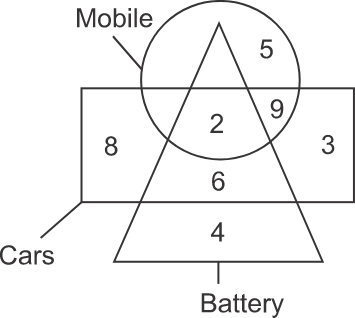
Q2. Directions: How many mobiles are not batteries?
A) 7
B) 5
C) 9
D) 14 (Correct)
Solution: To get the number of mobiles that are not batteries, determine the sum of numbers present in the region of mobiles that are not part of the region of battery. In the diagram, the shaded part represents the region common to mobiles but, uncommon to battery.
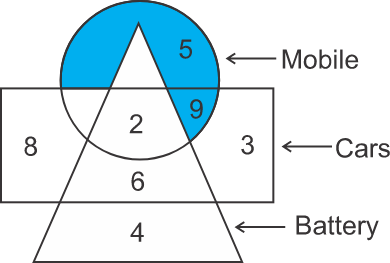
Therefore, the number is→5 + 9 = 14
So, from the above, the total number of mobiles that are not battery is 14. Hence, the fourth option is correct.
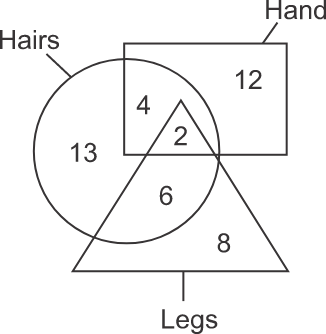
Q3. Directions: How many hands are hairs?
A) 8
B) 4
C) 6 (Correct)
D) 15
Solution: To get the number of hands that are hairs, determine the sum of the numbers falling in the part of the diagram where the regions represent hands and hairs. In the below diagram, the shaded part represents the region common to both hands and hairs as well as legs. The numbers of the asked fields that fall in the region of legs will also be counted as there is no direction given that the region belonging to legs can not be included.
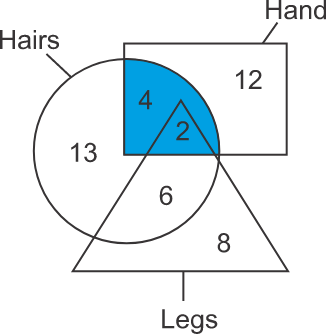
Therefore, the number is→4 + 2 = 6
So, from the above, 6 hands are hairs. Hence, the third option is correct.
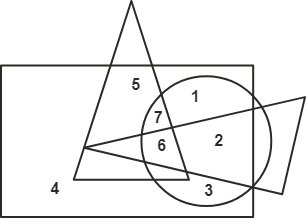
Q4. Directions: Which number is present only in one geometrical figure?
A) 3
B) 2
C) 5
D) 4 (Correct)
Solution: We need to pick the number which falls under only one of the given geometrical figures.
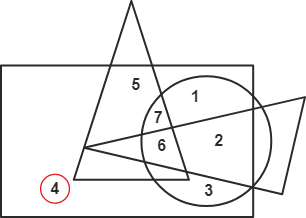
Here, 4 falls only under the rectangle's boundary in the given figure. Hence, the fourth option is correct.
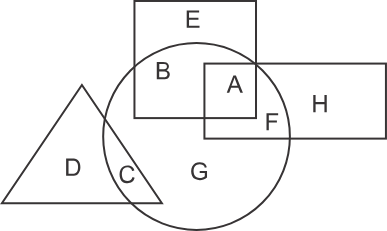
Q5. Directions: In the following diagram, the triangle represents doctors, the circle represents players and the rectangle represents singers. Which region represents doctors who are singers but not players?
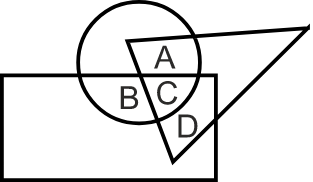
A) A
B) B
C) C
D) D (Correct)
Solution: Based on the given information in the question figure, we need to identify the letter that appears only in the area of the figures representing doctors and singers, i.e., triangle and rectangle, respectively. The highlighted part in the figure represents the doctors who are singers but not players.
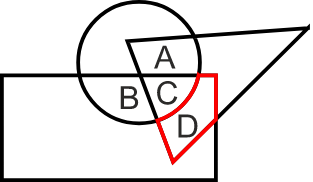
So, D is the region that represents doctors who are singers but not players. Hence, the fourth option is correct.
Venn Diagram Reasoning Questions for AP ICET/ IBSAT
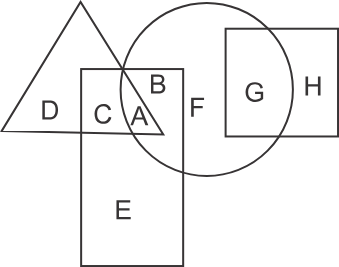
1) Directions: In the following figure, the square represents philosophers, the triangle represents police officers, the circle represents pharmacists and the rectangle represents Americans. Which set of letters represents Americans who are police officers?
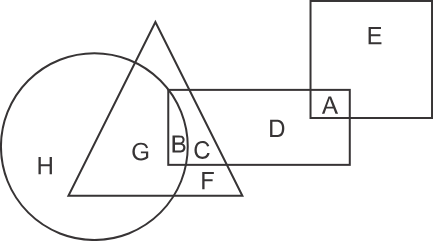
1) G, F, D, A
2) B, C
3) C, D
4) B, C, G, F
Hint: Focus on the overlapping region to both Americans and police officers.
Solution
In the below diagram, the shaded part represents the region common to both Americans and police officers as well as pharmacists. The numbers of the asked fields that fall in the region of pharmacists will also be counted as there is no direction given that the region belonging to pharmacists can not be included.
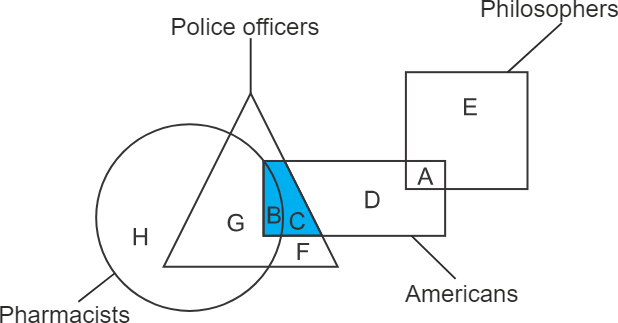
Therefore, the letters that represent Americans who are police officers are B and C. Hence, the second option is correct.
2) Directions: Which of the following diagrams represents the relationship among Complex numbers, Integers, and Natural numbers?
1)
2)
3)
4)
Hint: Observe the given terms and think about the most suitable Venn diagram given in the options.
Solution
Based on the general information all natural numbers are integers and all integers are complex numbers. Natural numbers start from 1 and go to infinity. Integer includes all natural numbers, zero and negative numbers. Complex numbers include all integers and imaginary numbers.
Using this information, the Venn diagram will be –
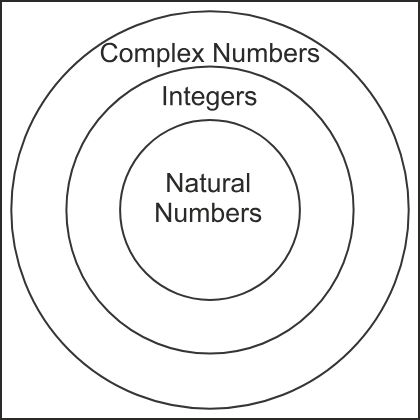
Hence, the third option is correct.
Venn Diagram Reasoning Questions for KMAT/ UPESMET/ JIPMAT
1) Directions: In the following figure, the square represents therapists, the triangle represents geneticists, the circle represents yoga practitioners and the rectangle represents fathers. Which set of letters represents yoga practitioners who are neither geneticists nor fathers?
1) C, B
2) E, A
3) G, C
4) F, G
Hint: Consider those letters falling in the region of yoga practitioners which are not part of the regions of fathers and geneticists.
Solution
In the diagram, the shaded part represents the region common to yoga practitioners but, uncommon to fathers and geneticists.
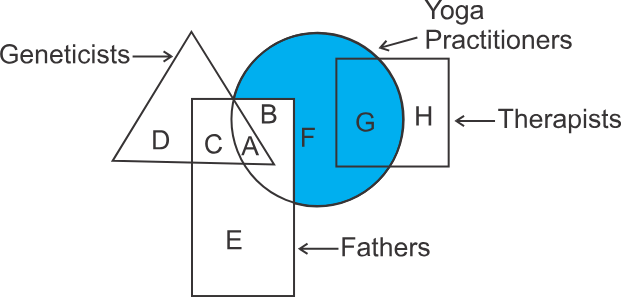
Therefore, the letters that represent yoga practitioners who are neither geneticists nor fathers are F and G. Hence, the fourth option is correct.
Best Books for Venn Diagram Reasoning & Logical Reasoning Preparation (SSC, Banking, RRB Exams)
This section highlights the most recommended books to master Venn diagram reasoning questions, including set theory concepts, formulas, logical classification, and practice questions to improve speed and accuracy in competitive exams.
| Book Name | Author | Best For | Key Features |
|---|---|---|---|
| A Modern Approach to Verbal & Non-Verbal Reasoning | R.S. Aggarwal | SSC, Banking, RRB | Covers Venn diagram questions with answers, logical classification, and reasoning basics |
| Analytical Reasoning | M.K. Pandey | SSC CGL, CAT, Banking | Strong focus on logical thinking and advanced Venn diagram reasoning questions |
| A New Approach to Reasoning | B.S. Sijwali & Indu Sijwali | SSC, Banking | Detailed explanations of set theory Venn diagram concepts and practice sets |
| Logical and Analytical Reasoning | A.K. Gupta | SSC, Banking | Covers all reasoning topics including Venn diagram formulas and questions |
| How to Prepare for Logical Reasoning | Arun Sharma | CAT, Banking | Advanced level Venn diagram reasoning questions with shortcut techniques |
| General Reasoning Ability for Competitive Exams | Disha Experts | SSC, Banking, Railways | Includes Venn diagram topic with theory, examples, and practice questions |
| Arihant Logical Reasoning | Arihant Experts | SSC, Defence Exams | Exam-oriented content with Venn diagram questions and solutions |
Verbal Reasoning Topics
Verbal reasoning evaluates a candidate’s ability to understand, interpret, and logically process information presented in words or numbers. It tests skills like comprehension, pattern recognition, and critical thinking, which are crucial for various competitive exams. Below are the important verbal reasoning topics you should focus on during your preparation.
Venn Diagram Important Formulae
This section brings together the most useful formulas you’ll need to handle set-based questions quickly and accurately. It gives you a crisp collection of results that make solving union, intersection, and complement problems far more intuitive during exams.
| Concept | Formula | Description |
|---|---|---|
| Union of Two Sets | $n(A \cup B) = n(A) + n(B) - n(A \cap B)$ | Core formula for 2-set Venn diagrams |
| Intersection of Two Sets | $n(A \cap B) = n(A) + n(B) - n(A \cup B)$ | Derived from the union formula |
| Only in A | $n(\text{Only A}) = n(A) - n(A \cap B)$ | Removes overlap |
| Only in B | $n(\text{Only B}) = n(B) - n(A \cap B)$ | Similar treatment |
| Neither A nor B | $n(\text{Neither}) = n(U) - n(A \cup B)$ | Useful in probability & DI |
| Union of Three Sets | $n(A \cup B \cup C) = n(A) + n(B) + n(C) - n(A \cap B) - n(B \cap C) - n(A \cap C) + n(A \cap B \cap C)$ | Standard 3-set formula |
| Exactly One of Three | $n(\text{Exactly 1}) = [n(A) + n(B) + n(C)] - 2[n(A\cap B) + n(B\cap C) + n(A\cap C)] + 3n(A\cap B\cap C)$ | Good for puzzle questions |
| Exactly Two of Three | $n(\text{Exactly 2}) = n(A\cap B) + n(B\cap C) + n(A\cap C) - 3n(A\cap B\cap C)$ | Removes triple intersection |
| None of Three | $n(\text{None}) = n(U) - n(A \cup B \cup C)$ | For complements |
| Complement | $n(A') = n(U) - n(A)$ | Works for any set |
Venn Diagram Reasoning Questions for SSC CHSL/ SSC Stenographer/ SSC CGL/ SSC CPO exams
1) Directions: Select the Venn diagram that best illustrates the relationship between the following classes.
Graduates, Educated, and Unemployed
1)
2)
3)
4)
Solution
As we know, educated people are the ones who go to educational institutions to acquire academic qualifications. So, we can say that all graduates will be educated because without acquiring a degree, a person cannot be called a graduate. On the other hand, not all educated people or graduates need to be employed because some might go for higher studies, or might contribute towards social work. So, some graduates/educated may be employed, some may be unemployed. Therefore, the circle of graduates lies inside the circle of educated, and the circle of unemployed intersects the circle of graduates and educated.
So, according to the above information, the Venn diagram will be as follows –
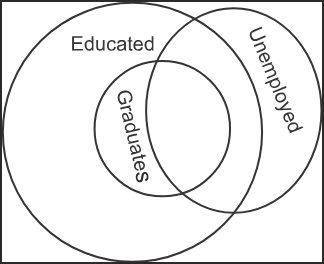
Hence, the second option is correct.
2) Directions: In the following figure, the square represents Pharmacists, the triangle represents Singers, the circle represents Surgeons and the rectangle represents Mothers. Which set of letters represents Surgeons who are either Mothers or Singers?
1) E, D, G
2) A, F, C
3) A, D, C
4) H, B, C
Hint: Make a set of the letters falling in the overlapping region between Surgeons and Mothers as well as between Surgeons and Singers.
Solution
In the diagram, the shaded part represents the overlapping region between Surgeons and Mothers as well as the overlapping region between Surgeons and Singers. Letters falling in the region of Pharmacists will also be considered in the case of overlapping as there is no restriction given on it in the question.
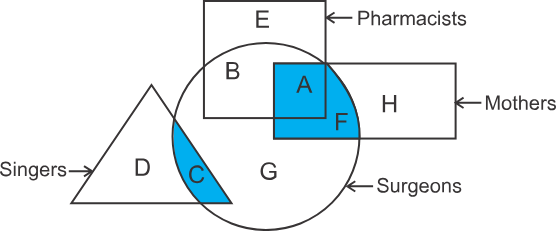
Therefore, the set of letters that represent surgeons who are either mothers or singers are A, F, and C. Hence, the second option is correct.
Venn Diagram Reasoning Questions for IBPS CWE Clerical/ IBPS RRB Assistant/ Railway Recruitment Board exams
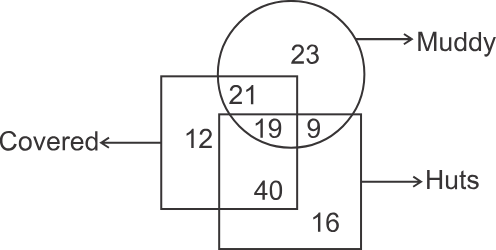
1) Directions: In the given figure, how many huts are covered and muddy?
1) 28
2) 40
3) 33
4) 19
Hint: Get the number falling in that part of the diagram where the region represents huts that are both covered and muddy.
Solution
According to the question, need to find the region which is common to muddy, covered, and huts. In the diagram, the shaded part represents the region common between huts, covered and muddy.
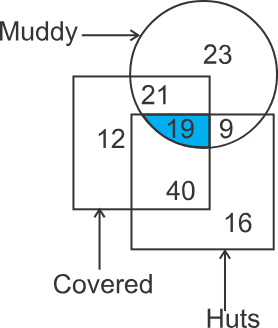
Therefore, the number of huts that are covered and muddy is 19. Hence, the fourth option is correct.
How to Solve Logical Venn Diagram Questions
Logical Venn diagram questions test a candidate’s ability to represent relationships between different sets through simple diagrams. These problems often appear in competitive exams to assess analytical thinking and data interpretation skills. A clear approach can make solving them faster and more accurate. Below are effective methods, tips, and common pitfalls to help you solve logical Venn diagram questions with ease.
Step-by-Step Method for Solving Venn Diagram Problems
Read the question carefully and identify the number of sets or groups involved.
Draw the required circles representing each set clearly without overlapping unnecessarily.
Mark the given data (numbers or elements) in the appropriate regions of the diagram.
Fill from the intersection first (common elements), then move to the exclusive areas.
Cross-check that the total number of elements matches the data given in the question.
Common Mistakes to Avoid in Venn Diagram Reasoning
Misplacing numbers in the wrong sections of the diagram.
Overlapping circles incorrectly, leading to logical inconsistency.
Ignoring zero or empty intersections when mentioned in the question.
Forgetting to verify that the sum of all regions equals the total given in the problem.
Short Tricks and Tips for Venn Diagram Questions with Solutions
Always start from the smallest intersection and move outward.
Use symbols or abbreviations for quick marking in exam conditions.
If options are given, use back-solving to eliminate incorrect diagrams quickly.
Practice Venn diagram reasoning PDF sets from previous competitive exams to improve speed.
Non-Verbal Reasoning Topics
Non-verbal reasoning focuses on problem-solving through visual patterns, figures, and shapes instead of words or numbers. It is widely used in competitive exams to assess observation skills, spatial awareness, and logical thinking. Below are the key non-verbal reasoning topics you should cover for effective preparation.
About the Faculty
Tanu Gupta, with over a decade of experience as a reasoning faculty, specializes in preparing students for various entrance examinations and career development. Her extensive work with multiple educational platforms and institutions has honed her expertise in logical and analytical thinking. Her dedication to innovative teaching methods ensures these articles provide practical insights and expert guidance.
Frequently Asked Questions (FAQs)
A Venn diagram is a visual representation of sets using circles to show relationships like common and distinct elements in Venn diagram reasoning questions.
In the SSC, Railways, CUET or Defence exams around 2-3 questions have been asked every year.
The questions related to dice are asked in various competitive exams such as SSC, Bank PO, Bank Clerk, Railway, Defence, UPSC, State PCS, etc.
The level of the questions of the dice has been seen as easy to moderate in the examinations.
Key concepts include sets, subsets, universal set, union, intersection, and complement, which are used in Venn diagram formulas.
There are four types of Venn Diagram reasoning which are Venn diagram to a relation, Relation to the Venn diagram, Caselets, Representation-based Venn diagram. So, to solve first two types of Venn diagram you should draw the images by establishing the relation between the given terms and in next two types you should solve the Venn diagram by observing the data in given diagrams.
Practice regularly, use Venn diagram questions with answers, and learn shortcut techniques to improve speed and accuracy.