


Question : Directions: Study the following bar graph showing the percentage of children who can read at first-grade level, grouped by their grade level in the Indian state.
For example, in 2008, 82% of the children from Std 3 could read a text from Std 1. Now answer the following question based on this graph.
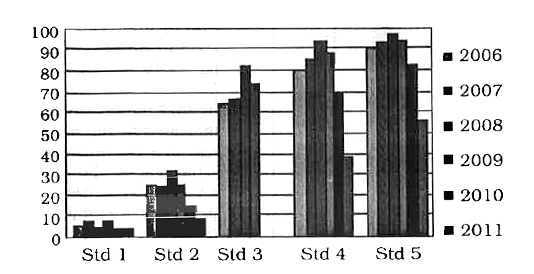
In the year 2010, what is the approximate value of the average of all Std 1, 2, 3, 4, and 5 children who could read the Std 1 text?
Option 1: 49.2%
Option 2: 57%
Option 3: 33%
Option 4: Data insufficient
Correct Answer: Data insufficient
Solution :
As per the given graph,
The number of children is unknown in Std 1.
Hence, the answer is Data insufficient.
Related Questions

Question : Directions: In the following question, select the missing number from the given responses.
| 6 | 11 | 25 |
| 8 | 6 | 16 |
| 12 | 5 | ? |
Option 1: 18
Option 2: 16
Option 3: 12
Option 4: 22
Know More about
Staff Selection Commission Sub Inspector ...
Application | Eligibility | Selection Process | Result | Cutoff | Admit Card | Preparation Tips
Get Updates Brochure
Your Staff Selection Commission Sub Inspector Exam brochure has been successfully mailed to your registered email id “”.


