


Mode of Grouped and Ungrouped Data: Definition, Formula, Calculator
Mode is one of the most important measures of central tendency in statistics and is used to identify the value that appears most frequently in a dataset. For example, if the marks scored by students are 12, 15, 15, 18, and 20, then 15 is the mode because it occurs the most. In mathematics and statistics, mode helps us understand patterns, trends, and the most common observation in a set of values. It is widely used in school mathematics, data handling, business analysis, and research. Questions based on mode are commonly asked in Class 9-10 Maths, statistics chapters, and competitive exams like SSC, Bank, CUET, CAT, and other quantitative aptitude tests. In this article, we will understand the mode of grouped and ungrouped data, formulas, solved examples, and how to calculate it easily using a mode calculator.
What is Mode in Statistics?
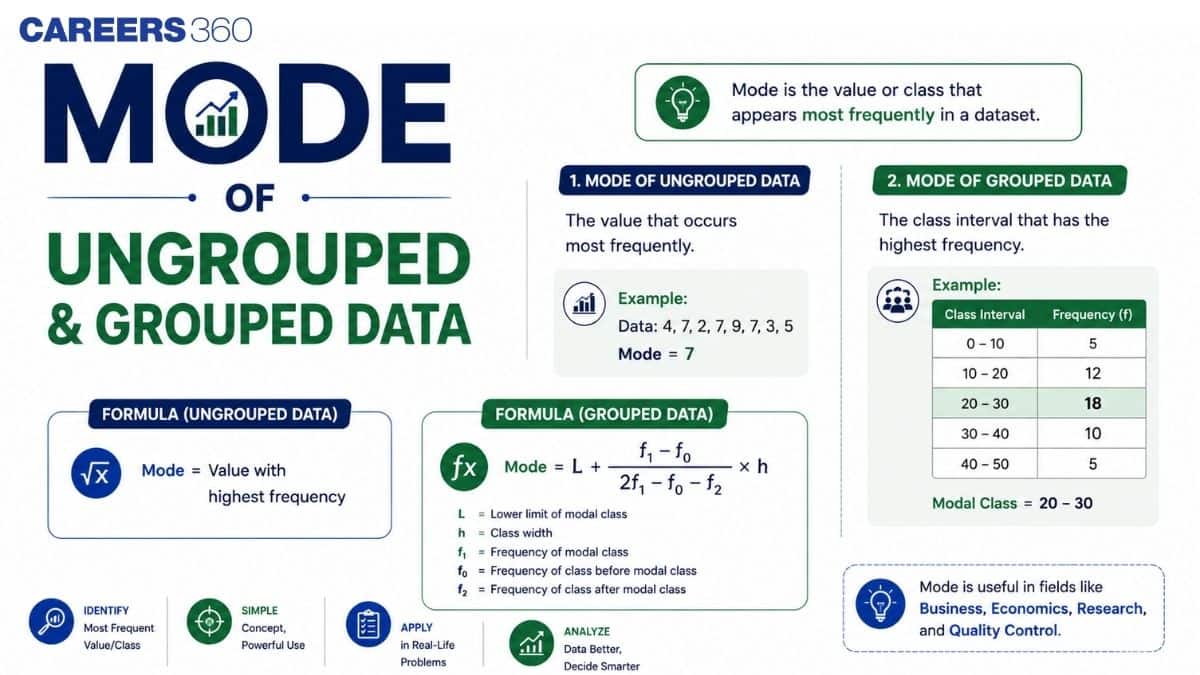
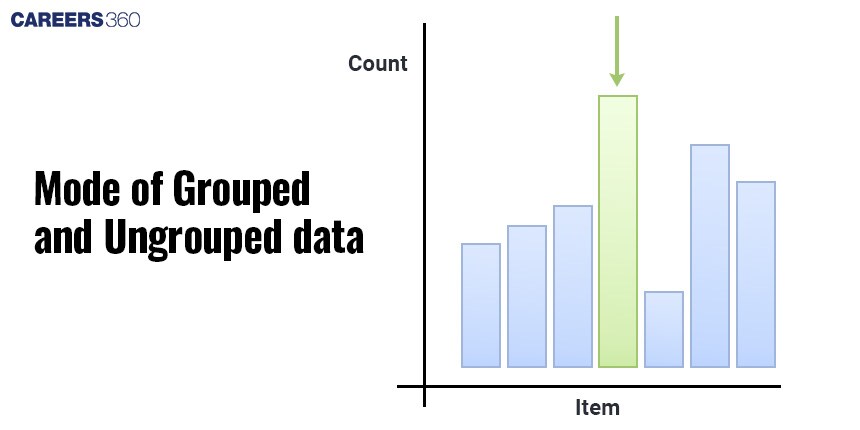
Mode is one of the most important measures of central tendency in statistics. It represents the value that occurs most frequently in a dataset. In simple words, mode tells us which observation repeats the most.
It is widely used in mathematics, statistics, business analysis, surveys, and research to identify the most common value or trend in a group of data.
Mode Meaning in Simple Words
Mode is the value that appears the maximum number of times in a set of data.
If one observation occurs more frequently than all others, that observation is called the mode.
For example:
$2,\ 4,\ 4,\ 6,\ 7,\ 4,\ 8$
Here, 4 appears three times, while the other numbers appear once.
Therefore:
Mode $= 4$
Real-Life Example of Mode
Mode is useful in everyday situations where we want to identify the most common item or repeated value.
Examples include:
- most popular shoe size in a store
- most common exam score in a class
- most ordered food item in a restaurant
- most preferred mobile brand in a survey
Suppose students choose their favourite fruit:
Apple, Mango, Banana, Mango, Orange, Mango
Since Mango appears most frequently,
Mode = Mango
Why Mode is Important in Statistics
Mode helps us understand what occurs most often in a dataset. It is useful when identifying common patterns, repeated responses, or popular choices.
Mode is important because:
- easy to understand and calculate
- shows the most frequent observation
- useful for both numbers and categories
- helps identify trends in data
- commonly used in surveys and business reports
Mode of Ungrouped Data
Ungrouped data means data listed in its original form without class intervals. To find mode in ungrouped data, we simply identify the value with the highest frequency.
Definition of Mode of Ungrouped Data
The mode of ungrouped data is the observation that appears most frequently among all the values.
If no number repeats, then the data may have no mode.
How to Find Mode in Ungrouped Data
To calculate mode in ungrouped data:
- Write all observations clearly
- Count how many times each value appears
- Find the value with maximum frequency
- That value is the mode
Solved Examples of Mode of Ungrouped Data
Example 1
Find the mode of:
$3,\ 5,\ 7,\ 5,\ 8,\ 5,\ 2,\ 7$
Solution
Frequency table:
| Observation | Frequency |
|---|---|
| 2 | 1 |
| 3 | 1 |
| 5 | 3 |
| 7 | 2 |
| 8 | 1 |
5 occurs most frequently.
Therefore:
Mode $= 5$
Example 2
Find the mode of:
$12,\ 15,\ 15,\ 18,\ 20,\ 15,\ 12$
Solution
| Observation | Frequency |
|---|---|
| 12 | 2 |
| 15 | 3 |
| 18 | 1 |
| 20 | 1 |
Hence,
Mode $= 15$
Mode of Grouped Data
When observations are arranged into class intervals along with frequencies, it is called grouped data. In this case, mode is found using a formula.
Definition of Mode of Grouped Data
The mode of grouped data is the value corresponding to the class interval having the highest frequency.
The class with the highest frequency is called the modal class.
Mode Formula for Grouped Data
The formula for mode of grouped data is:
$Mode = l + \frac{f_1-f_0}{2f_1-f_0-f_2}\times h$
Where:
| Symbol | Meaning |
|---|---|
| $l$ | Lower limit of modal class |
| $f_1$ | Frequency of modal class |
| $f_0$ | Frequency preceding modal class |
| $f_2$ | Frequency succeeding modal class |
| $h$ | Class width |
How to Calculate Mode of Grouped Data Step by Step
Follow these steps:
- Identify the class with the highest frequency
- This class is the modal class
- Write the values of $l$, $f_1$, $f_0$, $f_2$, and $h$
- Substitute in the formula
- Simplify to get the mode
Solved Examples of Mode of Grouped Data
Example
Find the mode of the following grouped data:
| Class Interval | Frequency |
|---|---|
| 0-10 | 5 |
| 10-20 | 8 |
| 20-30 | 12 |
| 30-40 | 7 |
| 40-50 | 3 |
Solution
Highest frequency = 12
So modal class = $20-30$
Thus:
$l = 20$
$f_1 = 12$
$f_0 = 8$
$f_2 = 7$
$h = 10$
Using formula:
$Mode = l + \frac{f_1-f_0}{2f_1-f_0-f_2}\times h$
$= 20 + \frac{12-8}{2(12)-8-7}\times10$
$= 20 + \frac{4}{24-15}\times10$
$= 20 + \frac{4}{9}\times10$
$= 20 + 4.44$
$= 24.44$
Therefore,
Mode $= 24.44$
Formula for Mode
The formula for mode depends on whether the data is ungrouped or grouped. For ungrouped data, mode can be found by observation, while for grouped data, we use a mathematical formula.
Knowing the correct mode formula makes it easier to solve statistics questions in school exams and quantitative aptitude.
Mode Formula for Ungrouped Data
For ungrouped data, there is no fixed algebraic formula. We simply identify the value that occurs most frequently.
Mode = Observation with highest frequency
Example
Find the mode of:
$5,\ 7,\ 8,\ 7,\ 9,\ 7,\ 10$
Frequency:
| Observation | Frequency |
|---|---|
| 5 | 1 |
| 7 | 3 |
| 8 | 1 |
| 9 | 1 |
| 10 | 1 |
Since 7 appears most often,
Mode $= 7$
Mode Formula for Grouped Data
For grouped frequency distribution, mode is calculated using the formula:
$Mode = l + \frac{f_1-f_0}{2f_1-f_0-f_2}\times h$
This formula gives the approximate value of the mode from grouped data.
Meaning of $l$, $f_1$, $f_0$, $f_2$, and $h$ in the Formula
Each term in the grouped data mode formula has a specific meaning.
| Symbol | Meaning |
|---|---|
| $l$ | Lower limit of modal class |
| $f_1$ | Frequency of modal class |
| $f_0$ | Frequency of class before modal class |
| $f_2$ | Frequency of class after modal class |
| $h$ | Class size or class width |
Quick Reference Table
| Symbol | Example Value |
|---|---|
| $l$ | 20 |
| $f_1$ | 15 |
| $f_0$ | 9 |
| $f_2$ | 7 |
| $h$ | 10 |
How to Calculate Mode?
Finding mode is one of the easiest topics in statistics. The method depends on whether the data is grouped or ungrouped.
Steps to Find Mode for Ungrouped Data
Follow these steps:
- Write all observations clearly
- Count how many times each value appears
- Identify the value with highest frequency
- That value is the mode
Example
Data:
$4,\ 6,\ 7,\ 6,\ 8,\ 6,\ 10$
6 appears 3 times.
Therefore:
Mode $= 6$
Steps to Find Mode for Grouped Data
For grouped data:
- Prepare the frequency table
- Identify the class with highest frequency
- Mark it as the modal class
- Note $l,\ f_1,\ f_0,\ f_2,\ h$
Use the formula:
$Mode = l + \frac{f_1-f_0}{2f_1-f_0-f_2}\times h$
- Simplify to get the answer
How to Identify the Modal Class
The modal class is the class interval with the highest frequency.
Example
| Class Interval | Frequency |
|---|---|
| 10-20 | 5 |
| 20-30 | 9 |
| 30-40 | 14 |
| 40-50 | 7 |
Highest frequency = 14
Therefore:
Modal Class = $30-40$
Once modal class is identified, use its lower limit and frequencies in the formula.
Mode Calculator
A mode calculator helps find the mode quickly without manual calculation. It is useful for checking answers and solving long datasets faster.
What is a Mode Calculator?
A mode calculator is an online tool that calculates the mode of a given dataset automatically.
You simply enter:
- numbers
- frequency values
- grouped data intervals
and the calculator returns the mode instantly.
How to Use the Mode Calculator
To use a mode calculator:
- Enter the data values
- Separate each value using commas
- Click Calculate
- The tool shows the mode instantly
For grouped data:
- enter class intervals
- enter frequencies
- calculate mode
Calculate Mode Online with Example
Suppose data is:
$4,\ 5,\ 5,\ 7,\ 8,\ 5,\ 9$
Input these values into the calculator.
Since 5 occurs three times,
Mode $= 5$
Mode calculators are helpful for students for:
- homework
- quick revision
- checking manual answers
- statistics practice
Difference Between Mean, Median, and Mode
Mean, median, and mode are the three main measures of central tendency. Each represents data differently.
Mean vs Median vs Mode
| Measure | Meaning | Formula / Method |
|---|---|---|
| Mean | Average of observations | Sum ÷ Number of observations |
| Median | Middle value of arranged data | Middle observation |
| Mode | Most frequent observation | Highest frequency value |
Example
Data:
$2,\ 3,\ 3,\ 5,\ 7$
Mean:
$\frac{2+3+3+5+7}{5}$
$= \frac{20}{5}$
$= 4$
Median:
Middle value = 3
Mode:
Most frequent value = 3
So:
- Mean = 4
- Median = 3
- Mode = 3
Which Measure of Central Tendency Should You Use?
The choice depends on the type of data.
| Situation | Best Measure |
|---|---|
| To find average marks | Mean |
| To find middle value | Median |
| To find most common value | Mode |
| For survey or category data | Mode |
| For skewed data | Median |
Mode is especially useful when the goal is to identify the most common observation in the dataset.
Relation Between Mean, Median, and Mode
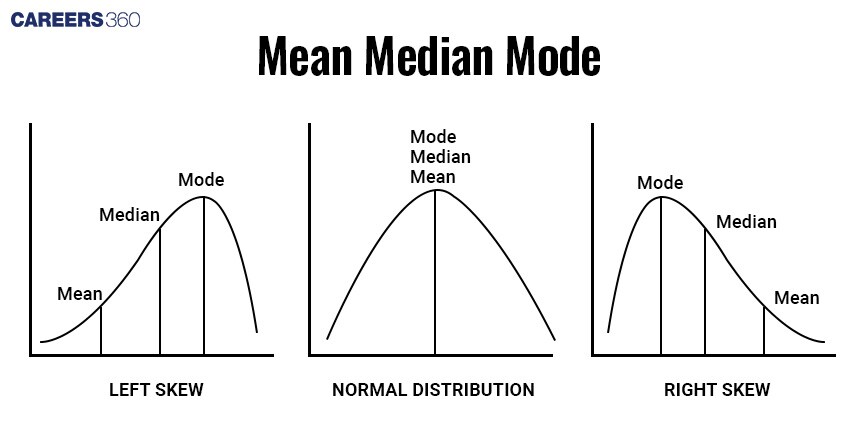
Mean, median, and mode are the three most important measures of central tendency in statistics. These three are connected through an empirical relationship, which is useful when one of the values is missing and the other two are known.
This relation is widely used in statistics questions in school mathematics, data interpretation, and quantitative aptitude exams.
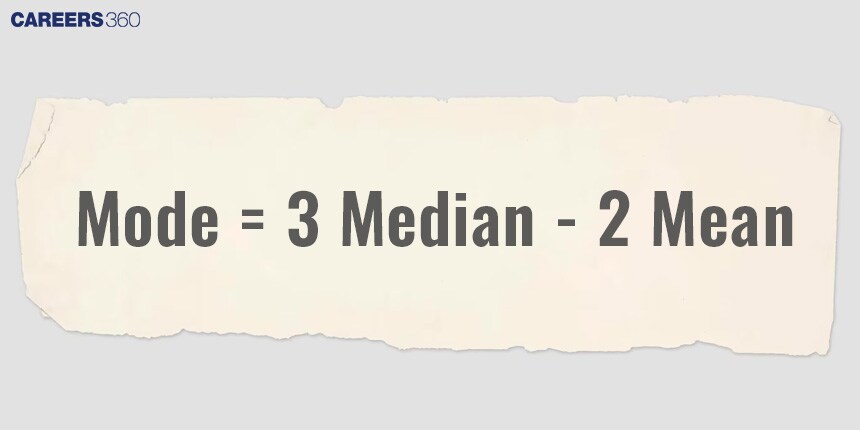
Empirical Formula
The empirical relationship between mean, median, and mode is:
$Mode = 3 \times Median - 2 \times Mean$
This formula helps calculate the mode when mean and median are given.
Formula Written in Terms of Mean
The above formula can be rearranged to find mean:
$Mean = \frac{3 \times Median - Mode}{2}$
This is useful when mode and median are known.
Formula Written in Terms of Median
Similarly, the formula can be written to find median:
$Median = \frac{Mode + 2 \times Mean}{3}$
This is used when mean and mode are given.
Important Formula Table
| To Find | Formula |
|---|---|
| Mode | $Mode = 3 \times Median - 2 \times Mean$ |
| Mean | $Mean = \frac{3 \times Median - Mode}{2}$ |
| Median | $Median = \frac{Mode + 2 \times Mean}{3}$ |
Solved Example
Example
Consider a dataset where:
Mean $= 50$
Median $= 48$
Find the mode.
Solution
Using the empirical formula:
$Mode = 3 \times Median - 2 \times Mean$
Substitute the values:
$Mode = 3 \times 48 - 2 \times 50$
$= 144 - 100$
$= 44$
Therefore,
Mode $= 44$
Key Points to Remember
- The empirical formula gives the relationship between mean, median, and mode
- It is mainly used in moderately skewed distributions
- If any two values are known, the third can be calculated easily
- Frequently asked in statistics and quantitative aptitude questions
This relation is very useful for quick calculations and solving multiple-choice questions based on measures of central tendency.
Best Books for Mode
The books below are useful for understanding mode in statistics, solving grouped and ungrouped data questions, and practicing exam-level problems. They are suitable for both school students and quantitative aptitude preparation.
| Book Name | Best For | Why It Helps |
|---|---|---|
| NCERT Mathematics Textbook | Class 9-10 students | Covers mode, mean, median, and statistics basics with examples |
| Quantitative Aptitude for Competitive Examinations | SSC, Bank, CUET, aptitude exams | Includes statistics concepts with practice questions on mode |
| Higher Algebra | Advanced mathematics learners | Useful for deeper understanding of mathematical statistics |
| Objective Arithmetic | Competitive exam preparation | Good for MCQs and topic-wise practice |
| Statistics for Economics | Statistics and economics students | Helpful for practical applications of mode and data analysis |
Shortcut Tips and Tricks to Find Mode
Mode is usually easy to calculate, but a few shortcut tricks can make it faster, especially in exams with limited time.
| Trick | Shortcut |
|---|---|
| Ungrouped data | Count frequency and pick highest repeated value |
| Grouped data | Identify modal class first, then apply formula |
| Modal class shortcut | Class interval with highest frequency |
| No repeated value | Dataset may have no mode |
| Two repeated highest values | Dataset is bimodal |
| More than two repeated highest values | Dataset is multimodal |
| Quick checking | Mode must belong to the dataset in ungrouped data |
Tips to Solve Mode Questions Quickly
These tips can help avoid mistakes while solving statistics questions on mode.
| Tip | Explanation |
|---|---|
| Count carefully | Small frequency mistakes change the answer |
| Arrange data clearly | Makes repeated values easier to spot |
| Check highest frequency twice | Helps confirm the mode |
| Identify modal class before formula | First step in grouped data questions |
| Write symbol values separately | Helps avoid substitution mistakes |
| Compare with mean and median | Useful in data interpretation questions |
| Use calculator for long values | Saves time in grouped data calculations |
Important Formula Table for Mode
This quick formula table is useful for revision before exams and solving statistics problems faster.
| Concept | Formula |
|---|---|
| Mode of Ungrouped Data | Observation with highest frequency |
| Mode of Grouped Data | $Mode = l + \frac{f_1-f_0}{2f_1-f_0-f_2}\times h$ |
| Modal Class | Class interval with highest frequency |
| Mean | $\frac{\sum x}{n}$ |
| Median | Middle observation after arranging data |
| Empirical Relation | $Mode = 3 \times Median - 2 \times Mean$ |
This table works well as a quick revision sheet for students preparing for statistics chapters, school exams, and quantitative aptitude tests.
Practice Questions based on Mode of Grouped and Ungrouped Data
Q1. The mode of the following data is:
13, 15, 31, 12, 27, 13, 27, 30, 27, 28, 16
- 28
- 27
- 30
- 31
Hint:
Mode is the value that appears most frequently in a dataset.
Solution:
Given data:
$13,\ 15,\ 31,\ 12,\ 27,\ 13,\ 27,\ 30,\ 27,\ 28,\ 16$
Count frequency of each value:
| Number | Frequency |
|---|---|
| 12 | 1 |
| 13 | 2 |
| 15 | 1 |
| 16 | 1 |
| 27 | 3 |
| 28 | 1 |
| 30 | 1 |
| 31 | 1 |
27 appears 3 times, which is the highest frequency.
Therefore,
Mode $= 27$
Correct Answer: 27
Q2. For a sample data, mean = 60 and median = 48. For this distribution, the mode is:
- 18
- 48
- 36
- 24
Hint:
Use:
$Mode = 3 \times Median - 2 \times Mean$
Solution:
Given:
Mean $= 60$
Median $= 48$
Using formula:
$Mode = 3 \times Median - 2 \times Mean$
$= 3 \times 48 - 2 \times 60$
$= 144 - 120$
$= 24$
Therefore,
Mode $= 24$
Correct Answer: 24
Q3. Find the mode for the given distribution (rounded off to two decimal places).
| Class Interval | Frequency |
|---|---|
| 5-10 | 8 |
| 10-15 | 7 |
| 15-20 | 6 |
| 20-25 | 9 |
| 25-30 | 11 |
| 30-35 | 10 |
- 35.25
- 40.25
- 30.33
- 28.33
Hint:
$Mode = l + \frac{f_1-f_0}{2f_1-f_0-f_2}\times h$
Solution:
Highest frequency = 11
So modal class = $25-30$
Therefore:
$l = 25$
$f_1 = 11$
$f_0 = 9$
$f_2 = 10$
$h = 5$
Using formula:
$Mode = l + \frac{f_1-f_0}{2f_1-f_0-f_2}\times h$
$= 25 + \frac{11-9}{2(11)-9-10}\times5$
$= 25 + \frac{2}{22-19}\times5$
$= 25 + \frac{2}{3}\times5$
$= 25 + 3.33$
$= 28.33$
Therefore,
Mode $= 28.33$
Correct Answer: 28.33
Q4. The following table represents the grouped data for the ages of a sample of people. What is the mode age group?
| Age Group | Frequency |
|---|---|
| 20-30 | 15 |
| 30-40 | 8 |
| 40-50 | 17 |
| 50-60 | 23 |
| 60-70 | 18 |
- 20-30
- 30-40
- 50-60
- 60-70
Solution:
The mode age group is the class interval with the highest frequency.
From the table:
Highest frequency = 23
Corresponding age group = $50-60$
Therefore,
Mode age group = $50-60$
Correct Answer: 50-60
Q5. In a frequency distribution table, the mode is:
- The value in the class with the highest frequency
- The value in the first class
- The value in the last class
- The average of all data values
Solution:
In a frequency distribution table, the mode is the value corresponding to the class interval with the highest frequency.
It represents the most frequently occurring observation in the dataset.
Therefore, mode is determined from the class having maximum frequency.
Correct Answer: The value in the class with the highest frequency
Q6. What is the mode of the ungrouped data:
$18,\ 22,\ 25,\ 18,\ 21,\ 22,\ 22,\ 25,\ 18,\ 25$
- 18
- 22
- 25
- All of the above
Solution:
Frequency table:
| Number | Frequency |
|---|---|
| 18 | 3 |
| 22 | 3 |
| 25 | 3 |
| 21 | 1 |
The highest frequency is 3.
Values with frequency 3 are:
- 18
- 22
- 25
Since more than one value has the highest frequency, the data is multimodal.
Correct Answer: All of the above
Q7. What is the mode of the given data?
$5,\ 7,\ 9,\ 7,\ 3,\ 7,\ 5,\ 7,\ 8,\ 6,\ 7$
- 7
- 6
- 5
- 3
Hint:
Mode is the observation with the highest frequency.
Solution:
Given data:
$5,\ 7,\ 9,\ 7,\ 3,\ 7,\ 5,\ 7,\ 8,\ 6,\ 7$
Count frequency:
| Number | Frequency |
|---|---|
| 3 | 1 |
| 5 | 2 |
| 6 | 1 |
| 7 | 5 |
| 8 | 1 |
| 9 | 1 |
7 appears 5 times, which is the highest.
Therefore,
Mode $= 7$
Correct Answer: 7
Related Quantitative Aptitude Topics
Below are some important quantitative aptitude topics frequently covered in mathematics and aptitude exams. Practicing these topics regularly can help improve concept clarity, calculation accuracy, and overall exam performance.
Frequently Asked Questions (FAQs)
Mode is the value that appears most frequently in a dataset. It represents the most common observation among all the values. Unlike the mean and median, the mode can be used for both numerical and categorical data. A dataset may have one mode (unimodal), more than one mode (bimodal or multimodal), or no mode at all if no number repeats.
Central tendency refers to the statistical measure that identifies a single value as representative of an entire dataset. This value is considered the central point around which the data tends to cluster.
Central tendency provides a summary statistic that represents the centre point or typical value of a dataset.
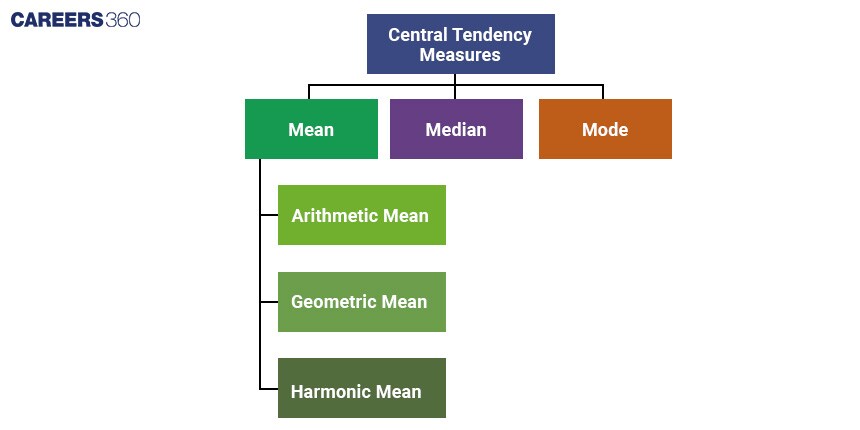
The three most common measures of central tendency are:
Mean
Median
Mode
Yes. There can be more than one mode for a given data set. That set is called Multimodal, which means a set with multiple modes.
Example: In the dataset, 1, 1, 1, 2, 3, 2, 3, 3, 4, the most common values are 1 and 3. (both repeat 3 times)
So, the mode of the dataset is 1 and 3.
The difference between the highest and lowest number of a dataset is called the range of that dataset.
Example:
In the dataset, 10, 12, 11, 10, 15, 20, 19, 21, 11, 9, 10
Highest value = 21
Lowest value = 9
So, the range of the dataset is 21 - 9 = 12
The formula for mode of grouped data is:
$Mode = l + \frac{f_1-f_0}{2f_1-f_0-f_2}\times h$
Where:
- $l$ = lower limit of modal class
- $f_1$ = frequency of modal class
- $f_0$ = frequency before modal class
- $f_2$ = frequency after modal class
- $h$ = class width
